AMAZONES - Carbon stocks and CO2 emissions
Part of the project Amazon Ecoservices (AMAZONES).
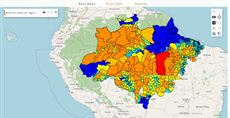
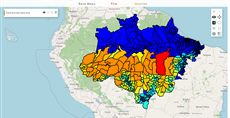
This map belongs to Amazon Ecoservices (AMAZONES) and is shown on its carbon stocks page. The “Carbon Stocks” group maps above-ground biomass and the threat of deforestation. The query layer “Amazon CO2 Emission by Deforestation” simulates losing 20% to 60% of the forest: the areas cleared in each scenario are chosen by deforestation threat, and the emissions follow from the biomass. Move the slider to choose the share deforested, type the price paid per tonne of CO2 (US$ 5.60 by default), and the map shows the cleared areas while a chart gives the CO2 emitted and its value for every scenario, with the chosen one in red. The code is query 6.
How it is built
- A slider with a live label. The
slidergoes from 20 to 60 in steps of 5; alabelusesgetidwithon_changeto rewrite “Deforested by N%” while you drag. See Slider and markup syntax. - A numeric text field (
isnumeric) holds the price per tonne. See Textfield. - A data file.
loadcsvreads the CO2 emitted in each scenario;beforeCalctakes the value of each row to build the chart. See LoadCsv. - Switching the map.
beforeCalccallschangeLayersto show the deforestation map of the chosen percentage. See the execution model. - The chart. A Highcharts spline chart with two series, CO2 emissions and CO2 value lost, over the nine scenarios. See charts.
- Pictures in the panel. The layer description embeds thumbnails of the threat and biomass maps next to the explanation.
Try this
- Drag the slider from 20% to 60% and watch the cleared area grow on the map.
- Change the price to 10 and compare the “CO2 Value Lost” line.
Reference: the parameters used here
Generated from the platform source. Every entry, searchable, is in the API reference; the raw data is api.json. Open an entry for its description, parameters and example; # links to it.
slider · number or range (input)
Slider4 entriesWritten in a layer's descriptionHtml as {{slider|parameter=value|...}}
increment
Number# Defines the step of each increment or decrement in the actual value of the slider when being dragged.
incrementDefines the step of each increment or decrement in the actual value of the slider when being dragged.
|increment = 10|maxValue
Number# Defines the maximum value of the slider.
maxValueDefines the maximum value of the slider.
|maxValue = 100|minValue
Number# Defines the minimum value of the slider.
minValueDefines the minimum value of the slider.
|minValue = 0|value
Number# Defines the initial value of the slider (default 100).
valueDefines the initial value of the slider (default 100).
At runtime the same value is what inputs.id[ID] (and inputs[i]) holds in beforeCalc/expression: a number, or an array [lower, upper] when the values range form is used. The layer recalculates on the slider change event (thumb released or value set from code).
|value = 100|beforeCalc: function(inputs) {
var threshold = inputs.id['deforestation_slider']; // number
}textfield · text box (input)
Textfield2 entriesWritten in a layer's descriptionHtml as {{textfield|parameter=value|...}}
Usage: '{{textfield}}'
isnumeric
boolean# Defines the TextField content as numeric only.
isnumericDefines the TextField content as numeric only.
|isnumeric=true|value
String# Defines the initial value to the TextField content.
valueDefines the initial value to the TextField content.
At runtime inputs.id[ID] (and inputs[i]) holds the current text exactly as typed (getRawValue(), always a string — convert it with parseFloat when isnumeric is used). The layer recalculates on every keyup (each keystroke); the widget also fires afteredit when the field loses focus with a changed value.
|value = text|beforeCalc: function(inputs) {
var price = parseFloat(inputs.id['soy_value']) || 0;
}label · text
Label1 entryWritten in a layer's descriptionHtml as {{label|parameter=value|...}}
Usage: {{label|}}
html
String# Defines the content of the label as raw HTML (not escaped).
htmlDefines the content of the label as raw HTML (not escaped). Everything after html= up to the next | is the value, so it may contain = characters. text wins when both are given.
{{label|cls=slider_label|html=0% <b>...</b> 100%|id=scale_label}}Markup rules for every widget
MarkupSyntax1 entryFunction-valued parameters (handler, runOnClick, runOnHover, onSelect, ...) are resolved in this order: a key of the layer 'functions' object, then a global with that name (setQueryGlobalProperties), then the text itself evaluated as a function (a body, or a full 'function(){...}' expression).
getid
Object# getid=ID gives access to an element created EARLIER in the same description (by any tag with that id).
getidgetid=ID gives access to an element created EARLIER in the same description (by any tag with that id). At the top level (|getid=slider1|) the element is stored in the tool config under getid; the common use is to attach a listener to it with getid=ID|getid=on_<event>=... (see on_event), or the nested param=getid=ID to hand the element to a parameter (scope=getid=btn). Order matters: the referenced tag must appear before the one using getid.
{{slider|id=perc_slider|value=20}}{{label|id=perc_label|text=20%|getid=perc_slider|getid=on_change=Ext.getCmp('perc_label').setText(this.getValue() + '%')}}loadcsv · load a CSV table (input)
LoadCsv2 entriesWritten in a layer's descriptionHtml as {{loadcsv|parameter=value|...}}
getLines
function(columns, values, includeHeader) : Array.<Array.<String>># Returns the lines (arrays of cell strings) whose cells in columns equal the corresponding entries of values.
getLinesReturns the lines (arrays of cell strings) whose cells in columns equal the corresponding entries of values. Columns may be given by index or by header name; to filter on several columns give one value per column, e.g. getLines([1, "Year"], ["Park A", 2024]). Values are compared as strings (the CSV is always text). Called with no arguments it returns every data line (header skipped) — a common idiom. When all filtered columns were indexed with createIndexes the lookup uses the index instead of scanning every line.
- columns Array.<(String|Number)>
- Indexes and/or names of the columns to filter on.
- values Array
- One value per entry of
columns. - includeHeader Boolean
- True to also return the header line when it matches (only in the scanning path, i.e. without indexes).
Returns The matching lines; all data lines when no filter is given.
var csv = inputs.id["fire_csv"];
var rows2024 = csv.getLines(["Year"], [2024]);      // by header name
var rowsParkA = csv.getLines([0, "Year"], ["Park A", 2024]); // two columns
var allRows = csv.getLines();                         // every data line
getValue
function(column, line, includeHeader) : String# Get a value by the matrix index and column.
getValueGet a value by the matrix index and column.
- column Number
- Column index (First index is 0).
- line Number
- Line index (First index is 0).
- includeHeader boolean
- True to include the header line in the matrix index, False to ignore.
Returns Get the cell value.
Highcharts · charts
Highcharts1 entryUsage: (Highcharts.chart(DOM_ID, {});)
chart
function(renderTo, options) : Object# Highcharts is loaded by the calculator and editor pages, so a query can call Highcharts.chart(...) without loading anything: put a container in the layer's descriptionHtml and create the chart …
chartWritten as Highcharts.chart
Highcharts is loaded by the calculator and editor pages, so a query can call Highcharts.chart(...) without loading anything: put a container in the layer's descriptionHtml and create the chart once the panel exists - in onInputsReady, in beforeCalc or in a widget handler - then update it as results arrive instead of recreating it. ExtjsUtils.HIGHCHART.getById(id) gives the chart back from the container's id, which is what makes the update possible from another callback.
The bundled build covers the standard chart types plus highcharts-more. Extra modules are loaded on demand with AsyncLoader.loadScriptOnce (see the Sankey entry).
- renderTo String
- Id of the container element declared in
descriptionHtml. - options Object
- The Highcharts configuration object.
Returns The chart instance.
descriptionHtml: '<div id="emissions_chart" style="height:220px"></div>',
functions: {
    drawChart: function (values) {
        var chart = ExtjsUtils.HIGHCHART.getById('emissions_chart');
        if (chart) { chart.series[0].setData(values); return; }
        Highcharts.chart('emissions_chart', {
            chart: { type: 'column' },
            title: { text: 'Emissions by year' },
            xAxis: { categories: ['2020', '2021', '2022'] },
            series: [{ name: 'Mt', data: values }]
        });
    }
}
Calculated layers: methods (this.)
LayerInternal1 entrychangeLayers
function(newConfigs, force)method# Replaces an internal layer at a given index.
changeLayersWritten as this.changeLayers
Replaces an internal layer at a given index. PS: It's highly recommended to pass multiple configurations in an array, instead of calling this function multiple times in the same callback.
- newConfigs Array|Object
- One or more layers configurations with a property 'index' indicating the replacing layer. Each config object must contain at least the following properties: [{name: 'MAP_FULL_NAME', styles: 'MAP_STYLE', index: 'MAP_INDEX_TO_CHANGE'}, ... ]
- force Boolean
- Force redraw even if no change is done when the layer is the same.
{
     name: "CSR:rodovias,CSR:municipios",
     otherNames: "CSR:roads",
     beforeCalc: function(layerVals, inputVals) {
         this.changeLayers([{name: 'CSR:roads', styles: fMapName + "_1", index: 0}]);
     }
  }
Layer callbacks: functions you write
LayersFunctions1 entrybeforeCalc
function= nullcallback# This function is executed before any calculation is made in the 'expression()' function.
beforeCalcThis function is executed before any calculation is made in the 'expression()' function. It runs on calculated layers (source: 'calculate'), even when there is no 'expression()', and on file layers (source: 'file'), where it runs again whenever an input changes or a resource finishes loading (see VectorLayer.generateNewLegend).
- inputs Array
- The value of each input defined in the descriptionHtml. The order of the values is the same as the inputs (i.e. the first input in the descriptionHtml is inputs[0], the second is inputs[1] and so on).
[
  {
     title: 'Example of beforeCalc function',
     color: '#FFA500',
     elements: [
        {
           title: 'This beforeCalc function will show a message at the bottom right of the screen',
           name: 'CSR:geologia',
           source: 'calculate',
           visibility: true,
           paramsButtonConfig: [
              {
                 type: 'query',
                 pressed: true
              },
           ],
           descriptionHtml:
              '{{label|text=The beforeCalc function will be called after every user interaction before any calculation}}'
              +
              '{{textfield|fieldLabel=Enter your name|id=textInput|labelStyle=text-align:center;}}',
           beforeCalc: function(inputs) {
              let inputValue = inputs[0];
              ExtjsUtils.ALERTIFY.log('Hello ' + inputValue + '!');
           },
        },
     ],
  },
]