Charts

Quick start

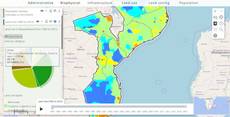
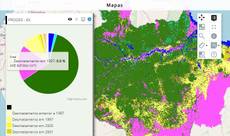
The example below, running in the Mappia calculator - click it to run it live. Full-size picture

  1. Run it

    Click the picture: the map opens right here and runs the example. Nothing is saved, and nothing to install.

  2. Try it
    • Look at the layer panel: a pie chart shows the area of each geological era.
    • Hover a slice: the tooltip shows that era’s share of the total area, in percent.
  3. Make it yours

    Copy the query, change it - the key parameters are below - and run it again in the playground, or paste it into the Mappia editor to save it as your map.

  4. More ways to use it

Key parameters

ParameterExampleWhat it does
chartHighcharts.chart("era_chart", { chart: { type: "pie" }, series: [{ data: data }] })Draws a chart into the element with that id. Declare the element in descriptionHtml first.
getHighchartByIdExtjsUtils.HIGHCHART.getById("era_chart")Returns the chart already drawn in that element, or null. Update or destroy it before drawing again.
loadScriptOnceAsyncLoader.loadScriptOnce("/theme/app/js/highcharts/latest/sankey.js", drawSankey)Loads an extra Highcharts module once, then calls your function. Needed for Sankey diagrams.

Every parameter, with its type and default, is in the reference at the end of this page.

Complete example

The query 33 lines · runs as is
// Charts: Highcharts is loaded on the map pages. Put a container in the panel, draw in
// afterCalc (the panel exists by then), and replace the chart on the next round.
[
  {
    title: "Geology - share by era",
    name: "CSR:geologia",
    source: "calculate",
    opacity: 0.8,
    visibility: true,
    paramsButtonConfig: [{ type: "query", pressed: true }],
    descriptionHtml:
      "{{loadjson|id=areas|url=/theme/app/data/geologia_area.json}}" +
      '<div id="era_chart" style="width:290px;height:240px"></div>',
    // afterCalc runs once the expression's values are computed, so the layer needs one
    expression: function (layersVals) {
      return layersVals[0];
    },
    afterCalc: function (inputs) {
      var areas = inputs.id["areas"];
      var data = Object.keys(areas).map(function (era) { return { name: era, y: areas[era] }; });
      var old = ExtjsUtils.HIGHCHART.getById("era_chart");
      if (old) old.destroy();
      Highcharts.chart("era_chart", {
        chart: { type: "pie" },
        title: { text: "Area by geological era" },
        credits: { enabled: false },
        tooltip: { pointFormat: "{point.percentage:.1f}%" },
        plotOptions: { pie: { dataLabels: { enabled: false } } },
        series: [{ name: "Area", data: data }],
      });
    },
  },
];

More examples

Other ways to use Charts, each a complete query that runs as is - like the one above.

A line chart from a CSV file

Loadcsv reads a table published next to the map, and afterCalc draws it in the panel - the CO2 emitted for each share of the forest cleared.

Click the picture to run it live. Full-size picture

The query 41 lines · runs as is
// A line chart from a CSV file: loadcsv reads a table published next to the map, and afterCalc draws it in the panel - the CO2 emitted for each share of the forest cleared.
// The input holds a CsvTable: getLineCount() and getValue(column, line), columns by position.
// afterCalc runs once the expression's values are computed, so the layer needs one.
[
  {
    title: "Carbon stock, and the cost of clearing it",
    name: "CSR:biomassa_inv_br_redd",
    source: "calculate",
    opacity: 0.8,
    visibility: true,
    paramsButtonConfig: [{ type: "query", pressed: true }],
    descriptionHtml:
      "{{loadcsv|id=emissions|url=/theme/app/data/emissoesco2.csv}}" +
      '<div id="emissions_chart" style="width:290px;height:220px"></div>',
    expression: function (layersVals) {
      return layersVals[0];
    },
    afterCalc: function (inputs) {
      var table = inputs.id["emissions"];
      var points = [];
      for (var line = 0; line < table.getLineCount(); line++) {
        // column 0: share of the forest cleared (%); column 1: CO2 emitted (tonnes)
        var cleared = parseFloat(table.getValue(0, line));
        var emitted = parseFloat(table.getValue(1, line));
        if (isNaN(cleared) || isNaN(emitted)) continue; // e.g. the empty line a file ends with
        points.push([cleared, emitted / 1e9]);
      }
      var old = ExtjsUtils.HIGHCHART.getById("emissions_chart");
      if (old) old.destroy();
      Highcharts.chart("emissions_chart", {
        chart: { type: "line" },
        title: { text: "CO2 emitted by clearing the forest" },
        credits: { enabled: false },
        legend: { enabled: false },
        xAxis: { title: { text: "Forest cleared (%)" } },
        yAxis: { title: { text: "Billion tonnes of CO2" } },
        series: [{ name: "CO2 emitted", data: points }],
      });
    },
  },
];

Customize it

Where to draw

Highcharts is already loaded on the map pages. Put a container with a fixed size in descriptionHtml (the layer panel is about 300 pixels wide), then draw from a callback, once the panel exists: afterCalc, beforeCalc, onInputsReady or a button handler. Never draw inside expression: it runs in a worker, where there is no page.

afterCalc runs only for a layer that has an expression. That is why the example has one, even though it only returns the map’s own value (return layersVals[0]).

Update instead of starting over

afterCalc runs after every calculation round, so a chart drawn there must deal with the previous one. Either destroy it, as the example does, or keep it and swap the data:

var chart = ExtjsUtils.HIGHCHART.getById("era_chart");
if (chart) {
  chart.series[0].setData(data);        // same chart, new values
} else {
  Highcharts.chart("era_chart", { chart: { type: "pie" }, series: [{ name: "Area", data: data }] });
}

Data for the chart

The example reads its numbers from a JSON file loaded with {{loadjson}}; a CSV works the same way with {{loadcsv}}. To reuse the map’s colors, read this.getLegendEntries(): each entry has color ([R, G, B]), title and isNull. It has no counts or areas, so the numbers must come from your data.

Sankey diagrams

A Sankey (flows between categories, such as land-use transitions) needs its module first. Each data row is one transition, [from, to, weight]:

AsyncLoader.loadScriptOnce("/theme/app/js/highcharts/latest/sankey.js", function () {
  Highcharts.chart("transitions_chart", {
    title: { text: "Land use transitions" },
    series: [{ type: "sankey", keys: ["from", "to", "weight"],
               data: [["Forest", "Pasture", 120], ["Pasture", "Crop", 45]] }],
  });
});

Pitfalls

  • Ids are page-wide: two layers cannot use the same container id.
  • A chart too large for the panel fits well in a Window.
  • The standard chart types are built in. Other Highcharts modules, like Sankey, must be loaded with AsyncLoader.loadScriptOnce before you draw.

Real maps that use it

Amazon on focus - Deforestation and fires by land category

Amazon on focus - Deforestation and fires by land category

Amazon on focus - Deforestation and fires by la...

AMAZONES - Biodiversity

AMAZONES - Biodiversity

AMAZONES - Brazil nut

AMAZONES - Brazil nut

AMAZONES - Carbon stocks and CO2 emissions

AMAZONES - Carbon stocks and CO2 emissions

AMAZONES - Fire

AMAZONES - Fire

AMAZONES - Non-timber rubber

AMAZONES - Non-timber rubber

AMAZONES - Hydrologic services

AMAZONES - Hydrologic services

Map publishing customization

Map publishing customization

FIP Cerrado - Fire monitoring (current map)

FIP Cerrado - Fire monitoring (current map)

Mitigation option project

Mitigation option project

REDD Brazil - Deforestation, emissions and credits

REDD Brazil - Deforestation, emissions and credits

SimAmazoniaINFRA - Deforestation and CO2 scenarios

SimAmazoniaINFRA - Deforestation and CO2 scenarios

AreaCategorical and GetLegend.

AreaCategorical and GetLegend.

AreaIntegral and SummedArea

AreaIntegral and SummedArea

Reference: the parameters used here

Generated from the platform source. Every entry, searchable, is in the API reference; the raw data is api.json. Open an entry for its description, parameters and example; # links to it.

Highcharts · charts

Highcharts1 entry
Highcharts is a library used to easly create interactive charts.
Usage: (Highcharts.chart(DOM_ID, {});)
Highcharts JS has a complete set of examples and a nice documentation that can be accessed here.

chart

function(renderTo, options) : Object# Highcharts is loaded by the calculator and editor pages, so a query can call Highcharts.chart(...) without loading anything: put a container in the layer's descriptionHtml and create the chart …

Written as Highcharts.chart

Highcharts is loaded by the calculator and editor pages, so a query can call Highcharts.chart(...) without loading anything: put a container in the layer's descriptionHtml and create the chart once the panel exists - in onInputsReady, in beforeCalc or in a widget handler - then update it as results arrive instead of recreating it. ExtjsUtils.HIGHCHART.getById(id) gives the chart back from the container's id, which is what makes the update possible from another callback.

The bundled build covers the standard chart types plus highcharts-more. Extra modules are loaded on demand with AsyncLoader.loadScriptOnce (see the Sankey entry).

renderTo String
Id of the container element declared in descriptionHtml.
options Object
The Highcharts configuration object.

Returns The chart instance.

descriptionHtml: '<div id="emissions_chart" style="height:220px"></div>',
functions: {
    drawChart: function (values) {
        var chart = ExtjsUtils.HIGHCHART.getById('emissions_chart');
        if (chart) { chart.series[0].setData(values); return; }
        Highcharts.chart('emissions_chart', {
            chart: { type: 'column' },
            title: { text: 'Emissions by year' },
            xAxis: { categories: ['2020', '2021', '2022'] },
            series: [{ name: 'Mt', data: values }]
        });
    }
}

Sankey · flow charts (Highcharts module)

Sankey1 entry
Soon.

load

function() : undefined# A Sankey diagram - transitions between categories drawn as flows - is a Highcharts module rather than part of the bundled build, so it is loaded on demand before the chart is created.

A Sankey diagram - transitions between categories drawn as flows - is a Highcharts module rather than part of the bundled build, so it is loaded on demand before the chart is created. Once the module is in place, a Sankey is an ordinary Highcharts chart with type: 'sankey', whose data is a list of [from, to, weight] rows: one row per transition, which is exactly the shape a transition matrix produces.

Load it once, when the panel is ready, and draw inside the callback - the module is shared, so a second call with the same URL is free.

Returns Nothing; the chart is created in the callback.

AsyncLoader.loadScriptOnce('/theme/app/js/highcharts/latest/sankey.js', function () {
    Highcharts.chart('transitions_chart', {
        title: { text: 'Land use transitions' },
        series: [{
            type: 'sankey',
            keys: ['from', 'to', 'weight'],
            data: [['Forest', 'Pasture', 120], ['Pasture', 'Crop', 45]]
        }]
    });
});

HIGHCHART, REGEX · charts and strings

Extjs1 entry
Chart lookup (ExtjsUtils.HIGHCHART) and string helpers (ExtjsUtils.REGEX). The interface itself is built with Ext JS 3.4.
View the full Extjs API 3.4 click here.
*Only the functions which where used in CSR projects are listed here.

getHighchartById

function(id) : Object# Gets a Highcharts chart instance by the id of the DOM element it was rendered into (renderTo), so query code can update a chart created in descriptionHtml after the data arrives.

Gets a Highcharts chart instance by the id of the DOM element it was rendered into (renderTo), so query code can update a chart created in descriptionHtml after the data arrives. The real call path is ExtjsUtils.HIGHCHART.getById(id).

id String
Id of the DOM element the chart was rendered into.

Returns The Highcharts chart object, or null when no chart uses that element.

var chart = ExtjsUtils.HIGHCHART.getById("highchart-01");
if (chart) chart.series[0].setData([10, 20, 30]);

AsyncLoader · load scripts once

AsyncLoader1 entry
Load one or more external resources by its URL and call a callback function when it finishes.
array: {Array} A array of resource urls to load.
callback: Function that will be called when the load ends.
Usage: AsyncLoader.loadScriptOnce({Array}, {Function}}

loadScriptOnce

function(src, callback)# Loads one or more external resources by URL, each of them only once per page, and calls callback after every URL of the set has finished loading.

Loads one or more external resources by URL, each of them only once per page, and calls callback after every URL of the set has finished loading. A URL ending in .css is inserted as a <link rel="stylesheet">; any other URL is inserted as an async <script> tag (placed before the first script of the page). Use it inside a query to lazy-load libraries or data files (Highcharts modules, PapaParse, a pre-baked JS data file) right before the code that needs them.

Rules worth knowing: a URL that already finished loading is skipped, so repeated calls are cheap and safe; when nothing in the set still needs loading the callback runs synchronously, before this function returns; calls made with the same set of pending URLs share one loading queue, and all their callbacks run once that set completes; the callback receives no arguments.

src String|Array.<String>
A resource URL, or an array of URLs to load together.
callback function
Called (with no arguments) once every URL in src is loaded.
AsyncLoader.loadScriptOnce(["/theme/app/js/papaparse.min.js", "/theme/app/js/highcharts/latest/sankey.js"], function() {
    // both files are loaded (or were already loaded): safe to use Papa and Highcharts.seriesTypes.sankey
    drawSankeyChart();
});
AsyncLoader.loadScriptOnce("/theme/app/css/my-query-styles.css");