Quick start
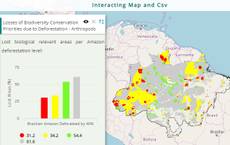
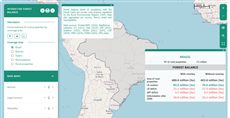
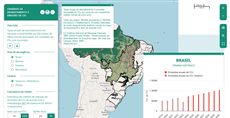
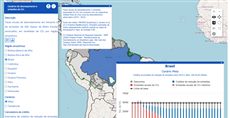
The example below, running in the Mappia calculator - click it to run it live. Full-size picture
- Run it
Click the picture: the map opens right here and runs the example. Nothing is saved, and nothing to install.
- Try it
- Read the panel: the chart plots carbon loss, in gigatonnes, against the share of forest lost.
- Hover a point of the line: the tooltip shows the carbon loss at that share.
- Point
urlat your own two-column CSV and run it again: the chart redraws from your numbers.
- Make it yours
Copy the query, change it - the key parameters are below - and run it again in the playground, or paste it into the Mappia editor to save it as your map.
Key parameters
| Parameter | Example | What it does |
|---|---|---|
url | /theme/app/data/emissoesco2.csv | Where the CSV is downloaded from; relative paths resolve on the Mappia server. Write = inside a query string as \=. |
id | emissions | Names the table: your callbacks read it as inputs.id["emissions"]. |
removeEmptyLines | true | Drops blank lines, such as a final newline, so they are not counted as data lines. |
cors | true | Downloads through the Mappia proxy, for servers that do not send CORS headers. |
getValue | table.getValue(1, line) | Reads one cell as text: column index first, then line. Line 0 is the first line after the header. |
getLineCount | table.getLineCount() | Number of data lines, header excluded. Loop from 0 up to it. |
Every parameter, with its type and default, is in the reference at the end of this page.
Complete example
The query 36 lines · runs as is
// LoadCsv: downloads a CSV before the layer calculates; its input value is a CSV table
// (row 0 = header, getValue(column, line) with line 0 = first data row). Drawn as a chart.
[
  {
    title: "Carbon loss by deforestation",
    name: "CSR:estados",
    source: "calculate",
    opacity: 0.35,
    visibility: true,
    paramsButtonConfig: [{ type: "query", pressed: true }],
    descriptionHtml:
      "{{loadcsv|id=emissions|url=/theme/app/data/emissoesco2.csv|removeEmptyLines=true}}" +
      '<div id="emissions_chart" style="width:290px;height:210px"></div>',
    // afterCalc runs once the expression's values are computed, so the layer needs one
    expression: function (layersVals) {
      return layersVals[0];
    },
    afterCalc: function (inputs) {
      var table = inputs.id["emissions"]; // columns: percentage, carbon_loss
      var points = [];
      for (var line = 0; line < table.getLineCount(); line++) {
        points.push([parseFloat(table.getValue(0, line)), parseFloat(table.getValue(1, line)) / 1e9]);
      }
      var old = ExtjsUtils.HIGHCHART.getById("emissions_chart");
      if (old) old.destroy();
      Highcharts.chart("emissions_chart", {
        title: { text: "Carbon loss (Gt)" },
        xAxis: { title: { text: "Forest lost (%)" } },
        yAxis: { title: { text: null } },
        legend: { enabled: false },
        credits: { enabled: false },
        series: [{ name: "Carbon loss", data: points }],
      });
    },
  },
];
Customize it
Where you can read the table
The table is available as inputs.id["emissions"] (the id you chose) in beforeCalc, onInputsReady and afterCalc, and as this.getInputs().id["emissions"] in the layer’s functions. The layer waits for the download before it calculates, so you never see a half-loaded table.
Two rules catch most people:
afterCalcruns only for a layer that has anexpression. Without one nothing is calculated andafterCalcnever runs - that is why the example has anexpressionthat just returnslayersVals[0].expressionruns in a worker, whereinputs.iddoes not exist. Work with the table in the page callbacks above.
The table methods
| Method | Returns |
|---|---|
getLineCount() | The number of data lines (the header is not counted) |
getValue(column, line) | One cell as text, trimmed. line 0 is the first data line |
getLines() | Every data line, each an array of cell texts |
getLines(columns, values) | Only the lines whose columns hold values, e.g. getLines(["state"], ["MG"]) |
columnNameToInd(name) | The index of a header, or -1 when there is none |
getColunsInd() | The header row. The misspelling is the real name: getColumnsInd does not exist |
createIndexes(columns) | Speeds up repeated getLines calls on the same columns |
Columns can be given by index or by header name. Look a value up by name like this:
afterCalc: function (inputs) {
  var table = inputs.id["prices"];
  var price = table.columnNameToInd("price");
  var lines = table.getLines(["state"], ["MG"]);   // lines whose "state" cell is "MG"
  if (price >= 0 && lines.length) {
    Ext.getCmp("price_label").setText("MG: " + lines[0][price]);
  }
},
Every cell is text
Convert with parseFloat before you calculate or compare, or "9" > "10" will surprise you. getLines compares values as text too.
Cells keep the spaces written in the file. getValue trims the cell it returns, but header names are never trimmed, so columnNameToInd needs the exact header text. In the example’s file the second header is ` carbon_loss, with a leading space - which is why the example reads its columns by index. trim=true` is accepted but does nothing.
Redraw, do not stack
afterCalc can run many times: once after every calculation round. Clear what the previous round drew before you draw again, as the example does by destroying the old chart. A chart larger than the panel fits well in a Window.
It counts as an input
{{loadcsv}} takes a position among the layer’s inputs, in markup order. If a slider comes after it, expression reads the slider as inputs[1], not inputs[0]. See the widget markup language for the full order rules.
Files on other servers
If the server does not send CORS headers, add cors=true. Inside a URL, write every = as \= (\\= inside a JavaScript string), or the markup reads it as a new parameter: {{loadcsv|id=tbl|url=https://example.com/data.csv?v\=2|cors=true}}.