AMAZONES - Fire
Part of the project Amazon Ecoservices (AMAZONES).
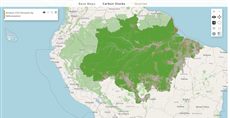
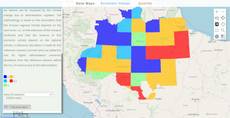
This map belongs to Amazon Ecoservices (AMAZONES) and is shown on its fire page. The “Fire” group maps simulated fire recurrence, simulated and observed fire scars, and effective and potential losses. Three query layers turn these into comparisons between places: “Potential economic losses (US$/ha)”, “Effective economic losses (US$/ha/year)” and “Total burned area (ha)”. In each one, choose municipalities or protected areas (and, for the two loss layers, the mean or the total), then click areas on the map: each click adds or removes an area, and a column chart compares the selection. The code is query 10.
How it is built
- Comboboxes per layer. Each query layer has its own
comboboxfor the kind of region, and the two loss layers a second one for mean or total losses. See Combobox. - Pickpoints collect the clicked areas. Three
pickpointwidgets (markLayerInd=1) store the clicked polygons’ attributes;beforeCalcreads them withgetAttributes(1)and clears them when the region type or item changes. See PickPoint. - changeLayers swaps the map. A combobox change loads the municipalities or protected-areas map, with the style of the chosen item. See the execution model.
- Column charts. Each layer draws one Highcharts column per picked area, in the area’s map colour. See charts.
- Same pattern, three times. The three layers repeat the same
beforeCalcwith different map names and attribute columns, which makes this query a compact reference for the pattern also used in the rubber map. - Groups are arrays whose first item gives the
titleandcolor. See the layer and group model.
Try this
- In “Total burned area (ha)”, choose Protected Areas and click three of them.
- In “Effective economic losses (US$/ha/year)”, switch from mean to total losses: the selection is cleared and the map takes the style of the new item.