Quick start
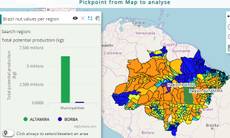
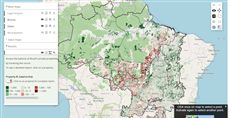
The example below, running in the Mappia calculator - click it to run it live. Full-size picture
- Run it
Click the picture: the map opens right here and runs the example. Nothing is saved, and nothing to install.
- Try it
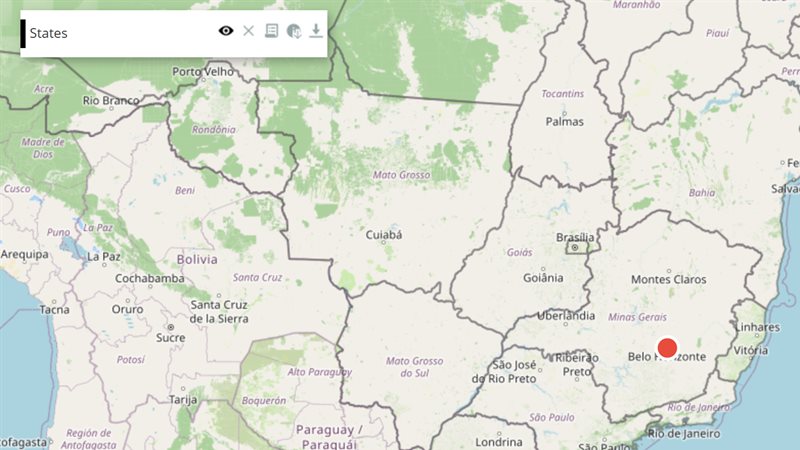
- Click a state on the map: its first four attributes appear in a notification.
- The switch turns off after the click; turn “Click a state on the map” on again to pick another state.
- Make it yours
Copy the query, change it - the key parameters are below - and run it again in the playground, or paste it into the Mappia editor to save it as your map.
Key parameters
| Parameter | Example | What it does |
|---|---|---|
onMark | onPicked | Name of a function in functions, called after each click with evt.features[mapIndex]: what each map holds at that point. |
onefeature | true | Keep only the last picked point. Without it, each click adds to the selection and clicking a picked feature again removes it. |
unselect | false | By default the tool switches itself off after each click; unselect=false keeps it on for several clicks. |
checked | true | Start with the tool switched on, so the first click on the map already picks. |
id | pick_state | Names the tool: inputs.id["pick_state"] holds the selection; read it with getAttributes(mapIndex) in beforeCalc. |
label | Region ${Name} | Text drawn on the map next to each picked feature; ${attribute} is replaced by that feature’s value. |
Every parameter, with its type and default, is in the reference at the end of this page.
Complete example
The query 24 lines · runs as is
// PickPoint: click the map to pick a feature; onMark receives the attributes of every map at
// that point (evt.features[mapIndex][i].data). onefeature keeps a single picked point.
[
  {
    title: "Pick a state",
    name: "CSR:estados",
    source: "calculate",
    opacity: 0.6,
    visibility: true,
    paramsButtonConfig: [{ type: "query", pressed: true }],
    descriptionHtml:
      "{{pickpoint|id=pick_state|text=Click a state on the map|checked=true|onefeature=true|geometryColor=#27ae60|onMark=onPicked}}",
    functions: {
      onPicked: function (evt) {
        var feature = evt.features && evt.features[0] && evt.features[0][0];
        if (!feature) return;
        var data = feature.data;
        ExtjsUtils.ALERTIFY.log(Object.keys(data).slice(0, 4).map(function (key) {
          return "<b>" + key + "</b>: " + data[key];
        }).join("<br>"));
      },
    },
  },
];
Customize it
Read what was picked
onMark receives one object per click:
evt.typeis"add"when the click picked something and"remove"when it unpicked it.evt.features[i]is what mapiofnamereturned at that point: an array whose first entry has the attributes in.data. It is empty on a removal.
Inside onMark, this is the tool, so this.value.getAttributes(i) lists the attributes of every picked point on map i, in click order ({} where the click hit nothing on that map). runOnClick is an alias of onMark; when you write both, onMark wins.
Use the selection in the calculation
The layer recalculates after every click, once every map has answered, so beforeCalc always sees the current selection:
beforeCalc: function (inputs) {
  var picked = inputs.id["pick_state"].getAttributes(0); // one object per picked point
  var names = picked.map(function (attrs) { return attrs.name; }); // an attribute of your map
  // use the plain values here, e.g. to swap a map with this.changeLayers(...)
}
Turn the selection into plain values in beforeCalc. Never hand the tool’s value itself to expression: it holds map features, and expression runs in a worker that only receives plain data (see the execution model).
Change what the tool draws
geometryColor=#FF00FFcolours the picked geometry; without it each click gets a random colour.markLayerInd=1chooses which map ofnamehas its clicked geometry drawn.pointVisibility=falsehides the marker at the clicked point;lat=-15.8|lon=-47.9places it before the first click.text=...is the label of the switch. Without it, the switch shows the coordinates of the last click.notify=falsehides the “click on the map” notification shown when the tool is switched on.
Control it from code
Ext.getCmp("pick_state").toggle(true)switches the tool on,falseoff; no argument inverts it.inputs.id["pick_state"].removeAll()clears the selection, for example from a{{button}}handler (therethisis the layer:this.getInputs().id["pick_state"]).removeAttribute(index)removes one picked point.getPointPos()gives[lon, lat]of the last click, in degrees.searchAttribute(mapIndex, "code", "3106200")returns the attributes of a picked feature whose attribute matches, ornull.
Charts from picked values
Highcharts is loaded on the map pages. Put a container such as <div id="pick_chart" style="height:220px"></div> in descriptionHtml and draw or update the chart from onMark. The pattern is on the Charts page.
Pitfalls
- The tool asks the map server what lies under the click, so
onMarkruns a moment after the click, once every map innamehas answered. - The tool lives on a
source: "calculate"layer, as in the example, and queries every map inname. - Write callbacks as regular
functions, not arrow functions: the tool setsthisfor them.