AMAZONES - Brazil nut
Part of the project Amazon Ecoservices (AMAZONES).
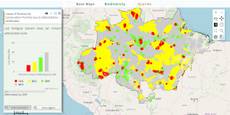
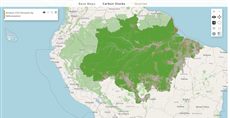
This map belongs to Amazon Ecoservices (AMAZONES) and is shown on its Brazil nut page. The “Brazil Nut” group maps the favourability, yield and rent of Brazil nut collection across the Amazon. The query layer “Brazil nut values per region” compares places: pick municipalities or protected areas, pick total potential production (kg), mean productivity (kg/ha) or mean rent (US$/ha/year), then click areas on the map. Each click adds or removes an area, and a column chart compares the selection. The code is query 4; it is built the same way as the rubber map, so the two are a good pair for seeing how one query is reused for another product by renaming its maps and widget ids.
How it is built
- Two comboboxes choose the kind of region and the item. See Combobox.
- A pickpoint collects the clicked areas. With
markLayerInd=1it stores each clicked polygon’s attributes;beforeCalcreads them withgetAttributes(1)and clears them when a combobox changes. See PickPoint. - changeLayers swaps the map. A combobox change makes
beforeCalcload the municipalities or the protected-areas map with the style of the chosen item. See the execution model. - A Highcharts column chart shows one column per picked area, in that area’s map colour. See charts.
- Groups are arrays whose first item gives the
titleandcolor. See the layer and group model.
Try this
- Keep Municipalities, choose “Total potential production (kg)” and click four municipalities in Acre and Pará.
- Switch to Protected Areas: the selection is cleared and the map changes.