Amazon on focus - Deforestation and fires by land category
Part of the project Amazon on focus.
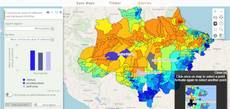
The map from Amazon on focus (in Portuguese) shows where deforestation and fires happened in the Amazon, split by land category: municipalities, conservation units, indigenous lands, rural settlements and undesignated public areas. Turn on one of these five layers and move the cursor over the map: a window shows the area’s infraction notices and embargoes (2009 to 2020), its burned and deforested area, whether fire led to deforestation or the reverse, a column chart of burned against deforested area per year (2009-2020) and a Sankey diagram of land-use transitions from 2009 to
- For municipalities it adds Forest Code figures and a link to the X-ray of the CAR. The window opens on Manaus; click the map to keep it on one area. The code is query 411.
How it is built
- Hover and click on a raster. Each of the five layers has a
hoverpixelwidget withrunOnHoverandrunOnClick;onHoverfills the window for the area under the cursor andonClickfreezes it. See Hoverpixel. - Two CSV files per category.
loadcsvreads a table of figures and a table of land-use transitions for each category;beforeCalcturns them into data keyed by area. See LoadCsv. - Column and Sankey charts. Highcharts draws the yearly columns and a
sankeyseries; the Sankey module is loaded on demand withAsyncLoader.loadScriptOnce. See charts. - Windows. A chart window and an introduction window (with the data sources) are
windowwidgets that open at start. See Window. - Legends and layer options. Base and input maps show
legendhtml, and a hiddenbuttonanchors each layer’s options menu. See LegendHtml and layer panel buttons. - Groups. Four
viewTitlegroups: the five interactive layers, base maps, input maps (rural properties, the land categories, deforestation, land use in 2009 and 2019) and a composition map of the fire-deforestation relation. See the layer and group model.
Try this
- With municipalities on, hover from Pará into Mato Grosso and watch the Sankey diagram change.
- Turn on indigenous lands and compare burned and deforested area in two neighbouring lands.
Reference: the parameters used here
Generated from the platform source. Every entry, searchable, is in the API reference; the raw data is api.json. Open an entry for its description, parameters and example; # links to it.
QUERY · setup calls and the running query
QUERY1 entrysetQueryGlobalProperties
function(globalProperties) : Booleanhelper# Defines globals for the query: every key of globalProperties becomes a window property (a value, an object or a function) that layer definitions, markup widgets (handler=, onMark=...) and …
setQueryGlobalPropertiesWritten as ExtjsUtils.QUERY.setQueryGlobalProperties
Defines globals for the query: every key of globalProperties becomes a window property (a value, an object or a function) that layer definitions, markup widgets (handler=, onMark=...) and other query code can reference by name. The names are recorded and the globals are deleted when another query loads. A key that already exists on window and was not created by the query is refused with "Global variable can't be redefined" in the console (the platform's own globals are protected; redefining one of the query's own keys is fine). runNow is the only key the platform itself invokes: right after the globals are registered QUERY.runNow is called once (see that entry). Chain it with && before the layer array so the globals exist when the layers are evaluated; QUERY_DESCRIPTION in the examples stands for that array.
- globalProperties Object
- Object whose keys become globals; each value may be a value, an object or a function.
Returns Always true, so the call can be chained with && QUERY_DESCRIPTION.
ExtjsUtils.QUERY.setQueryGlobalProperties({
  globalCount: 0,
  onLayerButton: function(btn) { console.log("clicked", btn); },
  runNow: function() { ExtjsUtils.ZOOM.limitZoomLevel(17); }
}) && [
  { name: "CSR:estados", visibility: true, descriptionHtml: "{{button|id=b1|text=Go|handler=onLayerButton}}" }
]
hoverpixel · value under the mouse (input)
Hoverpixel2 entriesWritten in a layer's descriptionHtml as {{hoverpixel|parameter=value|...}}
Usage: {{hoverpixel}}
runOnClick
function= undefined# Defines a callback when the user clicks on the map.
runOnClickDefines a callback when the user clicks on the map.
It passes the following parameters for the callback function: handleOnClick(layerVals, inputs, coordinates, clickEvent, lastCoordinates)
- layerVals Array
- Array with the values of the maps at the pixel that was clicked.
- inputs Array
- Array with the values of the inputs defined in the descriptionHtml.
- coordinates OpenLayers.LonLat
- The point that was clicked, in the map's projection (Web Mercator, metres) despite the names:
lonis x andlatis y. For degrees, transform it:coordinates.clone().transform(ExtjsUtils.JS.getMap().getProjectionObject(), new OpenLayers.Projection("EPSG:4326"))(lastCoordinates below already holds degrees, of the previous click and hover). - clickEvent MouseEvent
- Mouse event that triggered the function.
- lastCoordinates Object
- Object with the last coordinates (latitude, longitude) from the last click and the last hover events. lastCoordinates = { click: { lat: // Latitude of the last click lon: // Longitude of the last click }, hover: { lat: // Latitude of the last hover lon: // Longitude of the last hover } }
|handleOnClick: function(layerVals, inputs, coordinates, clickEvent, lastCoordinates) {
     var degrees = coordinates.clone().transform(ExtjsUtils.JS.getMap().getProjectionObject(), new OpenLayers.Projection("EPSG:4326"));
     ExtjsUtils.ALERTIFY.log("Latitude: " + degrees.lat.toFixed(3) + " Longitude: " + degrees.lon.toFixed(3));
}|
runOnHover
function= undefined# Defines a callback when the user hovers the map.
runOnHoverDefines a callback when the user hovers the map.
It passes the following parameters for the callback function: handleOnClick(layerVals, inputs, coordinates, clickEvent, lastCoordinates)
- layerVals Array
- Array with the values of the maps at the pixel that was hovered.
- inputs Array
- Array with the values of the inputs defined in the descriptionHtml.
- coordinates OpenLayers.LonLat
- The point that was hovered, in the map's projection (Web Mercator, metres) despite the names:
lonis x andlatis y. For degrees, transform it:coordinates.clone().transform(ExtjsUtils.JS.getMap().getProjectionObject(), new OpenLayers.Projection("EPSG:4326"))(lastCoordinates below already holds degrees, of the previous click and hover). - mouseMoveEvent MouseEvent
- Mouse event that triggered the function.
- lastCoordinates Object
- Object with the last coordinates (latitude, longitude) from the last click and the last hover events. lastCoordinates = { click: { lat: // Latitude of the last click lon: // Longitude of the last click }, hover: { lat: // Latitude of the last hover lon: // Longitude of the last hover } }
|handleOnHover: function(layerVals, inputs, coordinates, mouseMoveEvent, lastCoordinates) {
     ExtjsUtils.ALERTIFY.log("Latitude: " + coordinates.lat + " Longitude: " + coordinates.lon);
}|
loadcsv · load a CSV table (input)
LoadCsv1 entryWritten in a layer's descriptionHtml as {{loadcsv|parameter=value|...}}
getLines
function(columns, values, includeHeader) : Array.<Array.<String>># Returns the lines (arrays of cell strings) whose cells in columns equal the corresponding entries of values.
getLinesReturns the lines (arrays of cell strings) whose cells in columns equal the corresponding entries of values. Columns may be given by index or by header name; to filter on several columns give one value per column, e.g. getLines([1, "Year"], ["Park A", 2024]). Values are compared as strings (the CSV is always text). Called with no arguments it returns every data line (header skipped) — a common idiom. When all filtered columns were indexed with createIndexes the lookup uses the index instead of scanning every line.
- columns Array.<(String|Number)>
- Indexes and/or names of the columns to filter on.
- values Array
- One value per entry of
columns. - includeHeader Boolean
- True to also return the header line when it matches (only in the scanning path, i.e. without indexes).
Returns The matching lines; all data lines when no filter is given.
var csv = inputs.id["fire_csv"];
var rows2024 = csv.getLines(["Year"], [2024]);      // by header name
var rowsParkA = csv.getLines([0, "Year"], ["Park A", 2024]); // two columns
var allRows = csv.getLines();                         // every data line
Highcharts · charts
Highcharts1 entryUsage: (Highcharts.chart(DOM_ID, {});)
chart
function(renderTo, options) : Object# Highcharts is loaded by the calculator and editor pages, so a query can call Highcharts.chart(...) without loading anything: put a container in the layer's descriptionHtml and create the chart …
chartWritten as Highcharts.chart
Highcharts is loaded by the calculator and editor pages, so a query can call Highcharts.chart(...) without loading anything: put a container in the layer's descriptionHtml and create the chart once the panel exists - in onInputsReady, in beforeCalc or in a widget handler - then update it as results arrive instead of recreating it. ExtjsUtils.HIGHCHART.getById(id) gives the chart back from the container's id, which is what makes the update possible from another callback.
The bundled build covers the standard chart types plus highcharts-more. Extra modules are loaded on demand with AsyncLoader.loadScriptOnce (see the Sankey entry).
- renderTo String
- Id of the container element declared in
descriptionHtml. - options Object
- The Highcharts configuration object.
Returns The chart instance.
descriptionHtml: '<div id="emissions_chart" style="height:220px"></div>',
functions: {
    drawChart: function (values) {
        var chart = ExtjsUtils.HIGHCHART.getById('emissions_chart');
        if (chart) { chart.series[0].setData(values); return; }
        Highcharts.chart('emissions_chart', {
            chart: { type: 'column' },
            title: { text: 'Emissions by year' },
            xAxis: { categories: ['2020', '2021', '2022'] },
            series: [{ name: 'Mt', data: values }]
        });
    }
}
AsyncLoader · load scripts once
AsyncLoader1 entryarray: {Array} A array of resource urls to load.
callback: Function that will be called when the load ends.
Usage: AsyncLoader.loadScriptOnce({Array}, {Function}}
loadScriptOnce
function(src, callback)# Loads one or more external resources by URL, each of them only once per page, and calls callback after every URL of the set has finished loading.
loadScriptOnceLoads one or more external resources by URL, each of them only once per page, and calls callback after every URL of the set has finished loading. A URL ending in .css is inserted as a <link rel="stylesheet">; any other URL is inserted as an async <script> tag (placed before the first script of the page). Use it inside a query to lazy-load libraries or data files (Highcharts modules, PapaParse, a pre-baked JS data file) right before the code that needs them.
Rules worth knowing: a URL that already finished loading is skipped, so repeated calls are cheap and safe; when nothing in the set still needs loading the callback runs synchronously, before this function returns; calls made with the same set of pending URLs share one loading queue, and all their callbacks run once that set completes; the callback receives no arguments.
- src String|Array.<String>
- A resource URL, or an array of URLs to load together.
- callback function
- Called (with no arguments) once every URL in
srcis loaded.
AsyncLoader.loadScriptOnce(["/theme/app/js/papaparse.min.js", "/theme/app/js/highcharts/latest/sankey.js"], function() {
    // both files are loaded (or were already loaded): safe to use Papa and Highcharts.seriesTypes.sankey
    drawSankeyChart();
});AsyncLoader.loadScriptOnce("/theme/app/css/my-query-styles.css");window · floating window (input)
Window2 entriesWritten in a layer's descriptionHtml as {{window|parameter=value|...}}
It can only be shown when the layer is visible.
ignoreVisibility
Boolean# Defines if the window should ignore the layer visibility state.
ignoreVisibilityDefines if the window should ignore the layer visibility state. By default, the window visibility state is the same as the layer's. Set true to ignore the layer visibility state, false otherwise.
PS: The 'ignoreVisibility' is not compatible with the 'associatedButtonID' property. When both are used together, the ignoreVisibility value is ignored.
|ignoreVisibility = false|startVisible
Boolean# Defines if the window should start visible or not.
startVisibleDefines if the window should start visible or not. Set true if it should, false otherwise.
|startVisible = false|legendhtml · legend of the calculated map
LegendHtml1 entryWritten in a layer's descriptionHtml as {{legendhtml|parameter=value|...}}
Usage: '{{legendhtml}}'
preventClick
Boolean= false# Defines if the user can filter the maps categories by clicking on the legend.
preventClickDefines if the user can filter the maps categories by clicking on the legend. Set it true to ignore the legend click, false otherwise.
|preventClick = true|button · push or toggle button
Button9 entriesWritten in a layer's descriptionHtml as {{button|parameter=value|...}}
enableToggle
Boolean= false# Defines the button type as toggle.
enableToggleDefines the button type as toggle. Set true to use as toggle, false otherwise. PS: When its true the callback is 'toggleHandler', otherwise the callback is 'handler'.
|enableToggle=true|fieldLabel
String# Defines the button label.
fieldLabelDefines the button label.
|fieldLabel=A button|handler
function= undefined# Defines the callback function on button click event.
handlerDefines the callback function on button click event. This should be used when the enableToggle property is false. this inside the callback is the layer.
The value is resolved in this order: (1) a key of the layer functions object with that name; (2) a global function with that name (e.g. defined with setQueryGlobalProperties); (3) otherwise the text itself is evaluated as a function — either a full function(){...} expression or a plain statement body. With enableToggle=true and no toggleHandler, handler is used as the toggle handler.
- button Ext.Button
- The button element that was clicked.
- clickEvent EventObject
- An event object carrying information about the click event.
|handler=onExportClick||handler = function (button, clickEvent){
console.log(button, clickEvent);
}|hidden
Boolean= false# Set true to create the button hidden (Ext hidden config); show it later with Ext.getCmp(id).show().
hiddenSet true to create the button hidden (Ext hidden config); show it later with Ext.getCmp(id).show(). This is one example of the pass-through: every other Ext.Button config (iconCls, tooltip, cls, width, disabled, scale...) written in the markup is handed to the button unchanged.
|hidden=true|id
String# Defines the id to identify the object.
idDefines the id to identify the object.
|id=exemple_button|pressed
Boolean= false# Defines the button initial state.
pressedDefines the button initial state. Set it true to start pressed (only if enableToggle = true), false otherwise.
|pressed=true|text
String# Defines the button text.
textDefines the button text.
|text=Click On Me|toggle
function# Alias of toggleHandler: a function given as toggle= is moved to toggleHandler (unless one is already defined), so the Ext toggle() method of the button is never overwritten.
toggleAlias of toggleHandler: a function given as toggle= is moved to toggleHandler (unless one is already defined), so the Ext toggle() method of the button is never overwritten. Prefer toggleHandler.
|enableToggle=true|toggle=onToggleDetails|toggleHandler
function= undefined# Defines the callback function on button toggle event.
toggleHandlerDefines the callback function on button toggle event. This should be used when the enableToggle property is true. this inside the callback is the layer.
The value is resolved in this order: (1) a key of the layer functions object with that name; (2) a global function with that name (e.g. defined with setQueryGlobalProperties); (3) otherwise the text itself is evaluated as a function — either a full function(){...} expression or a plain statement body.
- button Ext.Button
- The button element that was clicked.
- state Boolean
- The next state of the button, true means pressed.
|enableToggle=true|toggleHandler=onToggleDetails||toggleHandler = function (button, pressed){
console.log(button, pressed);
}|Group properties
GroupProperties1 entryviewTitle
String= string.emptyproperty# Define the Title of the View that will gather together the elements inside it (Groups or other Views).
viewTitleDefine the Title of the View that will gather together the elements inside it (Groups or other Views). If an external View has in its elements another definition of a 'viewTitle', subviews will be created, like in the second example.
// Exemple 1: View with a Layers inside it
[
  {
     viewTitle: 'This View has a Group 3 Layers',
     title: 'This is a Group with 3 Layers',
     color: '#5BA300',
     elements: [
        {
           title: 'Layer 1',
           name: 'CSR:estados',
           source: 'local',
           opacity: 0.5,
           visibility: true,
        },
        {
           title: 'Layer 2',
           name: 'CSR:rios_principais',
           source: 'local',
           opacity: 0.5,
           visibility: true,
        },
        {
           title: 'Layer 3',
           name: 'CSR:geologia',
           source: 'local',
           opacity: 0.65,
           visibility: true,
        },
     ],
  },
]
// Exemple 2: View with others 'viewTitle' defined inside it
[
{
// This is the definition of the View
viewTitle: 'This External View has 2 others Inner Views inside it, each with 1 Group that has 1 Layer',
title: 'This View has 2 Groups, each with 1 Layer',
color: '#0073E6',
elements: [
{
title: 'Group 1',
// This 'viewTitle' will create a division in the menu that shows when the mouse hovers the navigation bar option 'This View has 2 Groups, each with 1 Layer'
viewTitle: 'Inner View with Group 1',
color: '#E6308A',
elements: [
{
title: 'Group 1 - Layer 1',
name: 'CSR:altimetria',
source: 'local',
visibility: true,
},
],
},
{
title: 'Group 2',
// This 'viewTitle' will create a division in the menu that shows when the mouse hovers the navigation bar option 'This View has 2 Groups, each with 1 Layer'
viewTitle: 'Inner View with Group 2',
color: '#B51963',
elements: [
{
title: 'Group 2 - Layer 1',
name: 'CSR:batimetria',
source: 'local',
visibility: true,
},
],
},
],
},
]