BrasilPec - Beef cattle intensification scenarios
Part of the project Scenarios for the intensification of beef cattle in Brazil.
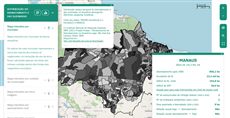
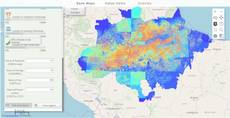
The map from Scenarios for the intensification of beef cattle in Brazil (in Portuguese) projects Brazilian cattle ranching year by year up to 2030. Six groups - Pastagem (pasture), Reforma de Pasto (pasture reform), Rebanho (herd), Taxa de Lotação (stocking rate), Confinamento (feedlots) and Margem de Lucro (profit margin) - hold one layer per scenario: baseline and intensificação for pasture, and base, mixpast, mixsup and mixsup2 for the others. Each of the 22 scenario layers has its own timeline: press play, or drag it, to step from 2012 (2013 for pasture reform) to 2030, one year per second. Query 144 shows how to animate many yearly maps without loading them all at once.
How it is built
- One timeline per layer. Each layer’s panel holds a
timelinewhose steps are the years, withnextStepInterval=1000; the layer row’s button is tied to it. See timeline panel and layer panel buttons. - A few years loaded at a time. Each year is a style of the scenario map. The layer lists the map five times with five styles; when the timeline leaves the years currently loaded,
beforeCalccallschangeLayersto load the next ones, then shows only the selected year. See the execution model. - Remembering state between rounds. An
inputmanagerwidget stores the last block of years, sochangeLayersruns only when the block changes. See InputManager. - Fixed legend classes. The feedlot layers call
setCalculateLegendwith eight classes, from 0 up to 150,000-360,000 (150,000-380,000 for mixsup2). See LegendHtml. - Shared helpers.
setQueryGlobalPropertiesdefines the year bookkeeping (MapManager,showOnlyOneLayer) used by all 22 layers. - Groups. Each group is an array whose first item gives its
titleandcolor. See the layer and group model.
Try this
- Open Confinamento, turn on two scenarios and play both timelines.
- Drag the pasture timeline straight from 2012 to 2030 and watch the map reload.