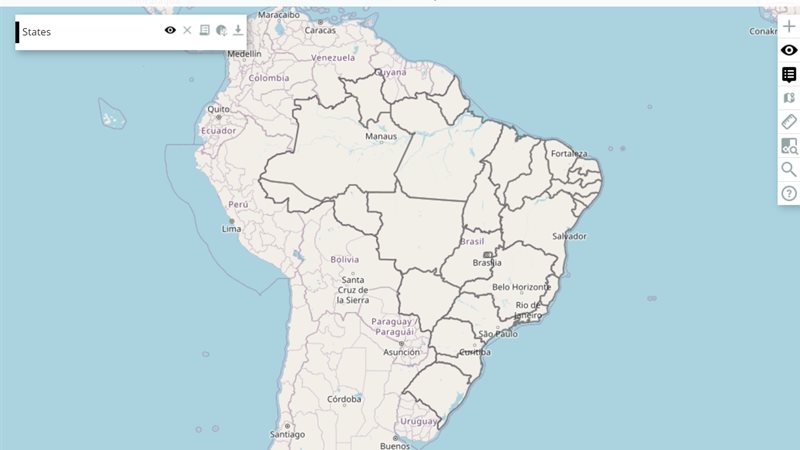
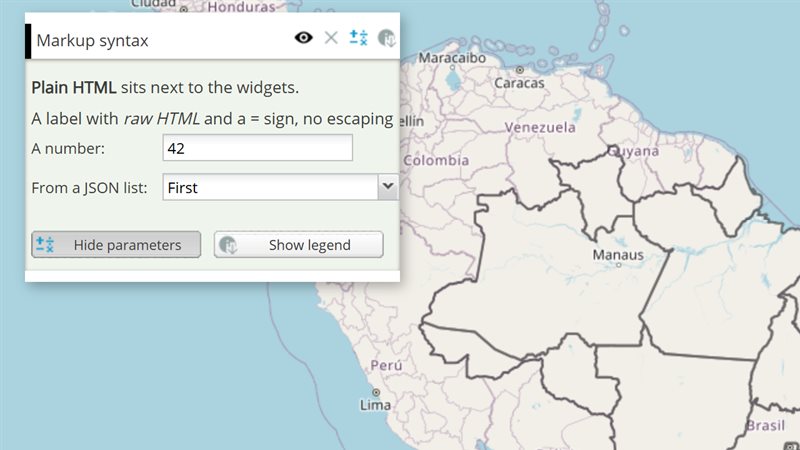
A Mappia map can live inside any page - a dashboard, a store front, a form, a plain HTML file - and work with it. MappiaIO is the small library that connects the two: your page loads https://maps.csr.ufmg.br/mappia_io.js, embeds the calculator in an <iframe>, and from then on its buttons, lists and forms drive the map, while the map tells the page what the user clicked, hovered or drew. The page decides what the map shows (applyQuery); the two exchange plain objects (send one way, ExtjsUtils.QUERY.postMessage the other).
How a message travels
Two windows - your page and the map inside its iframe - can only talk through the browser’s window.postMessage. MappiaIO wraps every message as {mappia_iframe: "<JSON text>"} and handles the start-up, so you only deal with your own objects:
- Your page (
mappia_io.js)The map (platform and your query) MappiaIO("mappia", true)mappia__checkDOMThe platform hears the greeting- Queued messages go out;
addReadyCallbackfunctions runmappia__confirmDOMThe platform answers: listening applyQuery(text)mappia__applyQueryThe platform loads your query- A
mappia__...string: a platform noticemappia__confirmQueryListeningThe query callsExtjsUtils.QUERY.setMappiaIoCallback(fn) - The new layers are in placemappia__queryAppliedThe platform finished applying
send({operation, message})your objectfn(object)runs in the queryaddOnMessageCallback(fn):fn(object)your objectExtjsUtils.QUERY.postMessage(object)
- Before the handshake nothing is lost:
sendandapplyQuerycalled right away wait in a queue and go out, in order, once the map answers. - Your messages are plain objects. They travel as JSON, so numbers, text, arrays and nested objects arrive intact; functions and dates do not. By convention an object names an
operationand carries amessage, plus arequestIdwhen the page waits for an answer. - Strings starting with
mappia__belong to the platform. Your page receives them too (mappia__queryAppliedis the useful one); never send them. - The page and the map may be on different sites - this page, on mappia.earth, talks to maps.csr.ufmg.br - and a message takes about 150 ms to arrive.
Try it
The playground below is a page talking to an embedded map exactly as yours would. Pick any example of this documentation and apply it with applyQuery, edit it and apply it again, or pick MappiaIO - the cities example of this page - and send it messages. The cities example also talks back: click a city, or press Send the cities in view to the page in the map’s panel, and watch the message arrive.
1. Apply a query applyQuery(text)
Query text - edit it freely (Ctrl+Enter applies it)
2. Send a message send(object)
The cities example answers these; other examples ignore them. Its own button in the map's panel talks back.
3. Messages
- Start the live map, then apply a query.
{"areaintegral-widget":{"query":"// AreaIntegral: two clicks define a rectangle; the tool sums each map inside it using the\n// summed-area (\"integral\") decoding, so the map must be published with that operation.\n[\n {\n title: \"Population density - rectangle sum\",\n name: \"CSR:pop_density_estimate_2015\",\n styles: \"1\",\n source: \"calculate\",\n operation: \"integral\",\n opacity: 0.7,\n visibility: true,\n paramsButtonConfig: [{ type: \"query\", pressed: true }],\n descriptionHtml:\n \"{{areaintegral|id=rectangle_sum|text=Sum a rectangle (two clicks)|runOnClick=onRectangle}}\",\n functions: {\n // bbox = [minLon, minLat, maxLon, maxLat] in EPSG:4326\n onRectangle: function (layersValues, inputs, bbox) {\n ExtjsUtils.ALERTIFY.log(\"Sum inside the rectangle: <b>\" +\n ExtjsUtils.NUMBER.abbreviateNumber(layersValues[0]) + \"</b>\");\n },\n },\n },\n];","view":[-74,-34,-34.5,5.5]},"background-selector":{"query":"// Background map picker: layers with group \"background\" are basemaps; backgroundSelector\n// shows them as thumbnails the user switches between. One basemap is visible at a time.\nExtjsUtils.CONFIGURATION.setOptions({ backgroundSelector: true }) && [\n { name: \"CSR:estados\", title: \"States\", visibility: true, opacity: 0.4 },\n { name: \"mapnik\", source: \"osm\", title: \"OpenStreetMap\", group: \"background\", visibility: true },\n { name: \"Topographic\", source: \"arcgisrest\", title: \"Topographic\", group: \"background\", visibility: false },\n];","view":[-74,-34,-34.5,5.5]},"button-widget--toggle-layer":{"query":"// Toggle another layer: a button that stays pressed shows a second layer of the map and hides it when released - here the state borders over a carbon map.\n// enableToggle=true makes the button a switch, and toggleHandler receives its new state.\n// On the map a plain layer is named by its title, so it is found by the map it shows (params.LAYERS).\n[\n {\n title: \"Carbon stock\",\n name: \"CSR:biomassa_inv_br_redd\",\n source: \"calculate\",\n opacity: 0.8,\n visibility: true,\n paramsButtonConfig: [{ type: \"query\", pressed: true }],\n descriptionHtml: \"{{button|id=borders|text=State borders|enableToggle=true|pressed=true|toggleHandler=showBorders}}\",\n functions: {\n showBorders: function (button, pressed) {\n this.map.layers.forEach(function (layer) {\n if (layer.params && layer.params.LAYERS === \"CSR:estados\") layer.setVisibility(pressed);\n });\n },\n },\n },\n {\n title: \"States\",\n name: \"CSR:estados\",\n opacity: 0.9,\n visibility: true,\n },\n];","page":"button-widget","title":"Toggle another layer","summary":"A button that stays pressed shows a second layer of the map and hides it when released - here the state borders over a carbon map.","view":[-70,-15,-50,2]},"button-widget":{"query":"// Button: runs a function. A handler named by text is looked up in the layer's functions\n// first, then among the globals; this = the layer.\n[\n {\n title: \"States\",\n name: \"CSR:estados\",\n source: \"calculate\",\n opacity: 0.6,\n visibility: true,\n paramsButtonConfig: [{ type: \"query\", pressed: true }],\n descriptionHtml: \"{{button|id=say_hello|text=Show a message|handler=sayHello}}\",\n functions: {\n sayHello: function () {\n ExtjsUtils.ALERTIFY.log(\"Hello from the layer <b>\" + this.name + \"</b>\");\n },\n },\n },\n];","view":[-74,-34,-34.5,5.5],"variants":["button-widget--toggle-layer"]},"charts--line-from-csv":{"query":"// A line chart from a CSV file: loadcsv reads a table published next to the map, and afterCalc draws it in the panel - the CO2 emitted for each share of the forest cleared.\n// The input holds a CsvTable: getLineCount() and getValue(column, line), columns by position.\n// afterCalc runs once the expression's values are computed, so the layer needs one.\n[\n {\n title: \"Carbon stock, and the cost of clearing it\",\n name: \"CSR:biomassa_inv_br_redd\",\n source: \"calculate\",\n opacity: 0.8,\n visibility: true,\n paramsButtonConfig: [{ type: \"query\", pressed: true }],\n descriptionHtml:\n \"{{loadcsv|id=emissions|url=/theme/app/data/emissoesco2.csv}}\" +\n '<div id=\"emissions_chart\" style=\"width:290px;height:220px\"></div>',\n expression: function (layersVals) {\n return layersVals[0];\n },\n afterCalc: function (inputs) {\n var table = inputs.id[\"emissions\"];\n var points = [];\n for (var line = 0; line < table.getLineCount(); line++) {\n // column 0: share of the forest cleared (%); column 1: CO2 emitted (tonnes)\n var cleared = parseFloat(table.getValue(0, line));\n var emitted = parseFloat(table.getValue(1, line));\n if (isNaN(cleared) || isNaN(emitted)) continue; // e.g. the empty line a file ends with\n points.push([cleared, emitted / 1e9]);\n }\n var old = ExtjsUtils.HIGHCHART.getById(\"emissions_chart\");\n if (old) old.destroy();\n Highcharts.chart(\"emissions_chart\", {\n chart: { type: \"line\" },\n title: { text: \"CO2 emitted by clearing the forest\" },\n credits: { enabled: false },\n legend: { enabled: false },\n xAxis: { title: { text: \"Forest cleared (%)\" } },\n yAxis: { title: { text: \"Billion tonnes of CO2\" } },\n series: [{ name: \"CO2 emitted\", data: points }],\n });\n },\n },\n];","page":"charts","title":"A line chart from a CSV file","summary":"Loadcsv reads a table published next to the map, and afterCalc draws it in the panel - the CO2 emitted for each share of the forest cleared.","view":[-70,-13,-50,2]},"charts":{"query":"// Charts: Highcharts is loaded on the map pages. Put a container in the panel, draw in\n// afterCalc (the panel exists by then), and replace the chart on the next round.\n[\n {\n title: \"Geology - share by era\",\n name: \"CSR:geologia\",\n source: \"calculate\",\n opacity: 0.8,\n visibility: true,\n paramsButtonConfig: [{ type: \"query\", pressed: true }],\n descriptionHtml:\n \"{{loadjson|id=areas|url=/theme/app/data/geologia_area.json}}\" +\n '<div id=\"era_chart\" style=\"width:290px;height:240px\"></div>',\n // afterCalc runs once the expression's values are computed, so the layer needs one\n expression: function (layersVals) {\n return layersVals[0];\n },\n afterCalc: function (inputs) {\n var areas = inputs.id[\"areas\"];\n var data = Object.keys(areas).map(function (era) { return { name: era, y: areas[era] }; });\n var old = ExtjsUtils.HIGHCHART.getById(\"era_chart\");\n if (old) old.destroy();\n Highcharts.chart(\"era_chart\", {\n chart: { type: \"pie\" },\n title: { text: \"Area by geological era\" },\n credits: { enabled: false },\n tooltip: { pointFormat: \"{point.percentage:.1f}%\" },\n plotOptions: { pie: { dataLabels: { enabled: false } } },\n series: [{ name: \"Area\", data: data }],\n });\n },\n },\n];","view":[-74,-34,-34.5,5.5],"variants":["charts--line-from-csv"]},"checkbox-widget--class-filters":{"query":"// Several switches, one filter: each checkbox turns one class of the map on or off - here dry, moderate and wet places by annual rainfall.\n// Checkboxes are not inputs: one handler writes the state of the checkbox it is called for into an\n// inputmanager (setValues merges keys and recalculates), and expression reads the three states.\n[\n {\n title: \"Rainfall classes\",\n name: \"CSR:precip_annual_average\",\n source: \"calculate\",\n opacity: 0.85,\n visibility: true,\n paramsButtonConfig: [{ type: \"query\", pressed: true }],\n descriptionHtml:\n \"{{inputmanager|id=classes}}\" +\n \"{{checkbox|id=show_dry|text=Dry: below 800 mm|checked=true|hideLabel=true|handler=onClassToggle}}\" +\n \"{{checkbox|id=show_moderate|text=Moderate: 800 to 1200 mm|checked=true|hideLabel=true|handler=onClassToggle}}\" +\n \"{{checkbox|id=show_wet|text=Wet: above 1200 mm|checked=true|hideLabel=true|handler=onClassToggle}}\",\n functions: {\n // this = the layer; the checkbox's id names the class it switches\n onClassToggle: function (checkbox, checked) {\n var values = {};\n values[checkbox.id.replace(\"show_\", \"\")] = checked;\n this.getInputs().id[\"classes\"].setValues(values);\n },\n },\n onInputsReady: function (inputs) {\n inputs.id[\"classes\"].setDefaultValues({ dry: true, moderate: true, wet: true });\n },\n // The legend lists only the classes shown. That also makes the layer recalculate: a change of\n // the inputs that leaves the legend as it was does not redraw the map.\n beforeCalc: function (inputs) {\n var show = inputs.id[\"classes\"].global;\n var legend = [];\n if (show.dry) legend.push({ color: [230, 160, 40], value: 1, title: \"Dry (below 800 mm)\" });\n if (show.moderate) legend.push({ color: [120, 180, 90], value: 2, title: \"Moderate (800 - 1200 mm)\" });\n if (show.wet) legend.push({ color: [40, 110, 190], value: 3, title: \"Wet (above 1200 mm)\" });\n this.setCalculateLegend(legend);\n },\n expression: function (layersVals, inputs) {\n var show = inputs[0].global; // the inputmanager: the only input\n var rainfall = layersVals[0];\n if (!this.isNumeric(rainfall)) return this.nullValue;\n var rainClass = rainfall < 800 ? 1 : rainfall <= 1200 ? 2 : 3;\n var shown = rainClass === 1 ? show.dry : rainClass === 2 ? show.moderate : show.wet;\n return shown ? rainClass : this.nullValue;\n },\n },\n];","page":"checkbox-widget","title":"Several switches, one filter","summary":"Each checkbox turns one class of the map on or off - here dry, moderate and wet places by annual rainfall.","view":[31,-27,41,-10]},"checkbox-widget":{"query":"// Checkbox: not an input itself. Its handler stores the state in an inputmanager, whose\n// plain \"global\" values are what reach expression() (inputs[0] - checkboxes take no position).\n[\n {\n title: \"Carbon-rich soils switch\",\n name: \"CSR:soil_organic_carbon_stock\",\n source: \"calculate\",\n opacity: 0.85,\n visibility: true,\n paramsButtonConfig: [{ type: \"query\", pressed: true }],\n descriptionHtml:\n \"{{checkbox|id=only_rich|text=Only soils above 50 Mg/ha|checked=true|hideLabel=true|handler=onToggle}}\" +\n \"{{inputmanager|id=state}}\",\n functions: {\n // this = the layer; called with the checkbox and its new state\n onToggle: function (checkbox, checked) {\n this.getInputs().id[\"state\"].setValues({ onlyRich: checked }); // recalculates\n },\n },\n onInputsReady: function (inputs) {\n inputs.id[\"state\"].setDefaultValues({ onlyRich: true });\n },\n // The legend shows what the map shows - and changing it is what redraws the map: a change of\n // the inputs that leaves the legend as it was does not. The class always shown is value 1, the\n // optional one comes after it (legend values in ascending order).\n beforeCalc: function (inputs) {\n var legend = [{ color: [121, 85, 72], value: 1, title: \"Above 50 Mg/ha\" }];\n if (!inputs.id[\"state\"].global.onlyRich) legend.push({ color: [241, 196, 15], value: 2, title: \"Below 50 Mg/ha\" });\n this.setCalculateLegend(legend);\n },\n expression: function (layersVals, inputs) {\n var onlyRich = inputs[0].global.onlyRich;\n if (layersVals[0] >= 50) return 1;\n return onlyRich ? this.nullValue : 2;\n },\n },\n];","view":[34,-20,41,-10],"variants":["checkbox-widget--class-filters"]},"combobox-widget--switch-map":{"query":"// Pick the map: the list switches which map the layer shows - one layer, three maps of the Amazon, changed with changeLayers when the reader picks.\n// Every map the layer may show is declared: the first in name, the others in otherNames.\n// onSelect runs on each pick with (combo, record); record.get(\"value\") is the text picked.\n[\n {\n title: \"One layer, three maps\",\n name: \"CSR:biomassa_baccini_bioma_am\",\n otherNames: \"CSR:biomassa_inv_br_redd,CSR:altimetria\",\n source: \"calculate\",\n opacity: 0.8,\n visibility: true,\n paramsButtonConfig: [{ type: \"query\", pressed: true }],\n descriptionHtml:\n \"{{combobox|id=shown_map|fieldLabel=Map|editable=false|width=170|onSelect=showMap\" +\n '|data=[[\"Forest biomass\"],[\"Carbon stock\"],[\"Elevation\"]]}}' +\n \"{{legendhtml}}\",\n functions: {\n showMap: function (combo, record) {\n var maps = { \"Forest biomass\": \"biomassa_baccini_bioma_am\", \"Carbon stock\": \"biomassa_inv_br_redd\", \"Elevation\": \"altimetria\" };\n var map = maps[record.get(\"value\")];\n this.changeLayers([{ name: \"CSR:\" + map, styles: map + \"_1\", index: 0 }]); // a map's default style is <map>_1\n },\n },\n },\n];","page":"combobox-widget","title":"Pick the map","summary":"The list switches which map the layer shows - one layer, three maps of the Amazon, changed with changeLayers when the reader picks.","view":[-68,-13,-50,1]},"combobox-widget":{"query":"// Combobox: pick a value from a list. data is a list of one-value entries - the list shows the value itself;\n// the input holds the selected value (the first entry until the user picks another).\n[\n {\n title: \"Forest biomass above a chosen level\",\n name: \"CSR:biomassa_baccini_bioma_am\",\n source: \"calculate\",\n opacity: 0.85,\n visibility: true,\n paramsButtonConfig: [{ type: \"query\", pressed: true }],\n descriptionHtml:\n \"{{combobox|id=level|fieldLabel=Above (t/ha)|editable=false|width=160\" +\n '|data=[[\"200\"],[\"100\"],[\"300\"]]}}', // one value per entry: the list shows the values themselves\n beforeCalc: function (inputs) {\n this.setCalculateLegend([\n { color: [22, 160, 133], value: 1, title: \"Above \" + inputs.id[\"level\"] + \" t/ha\" },\n ]);\n },\n expression: function (layersVals, inputs) {\n return layersVals[0] >= parseFloat(inputs[0]) ? 1 : this.nullValue;\n },\n },\n];","view":[-58,-10,-45,-1],"variants":["combobox-widget--switch-map"]},"drawing-tools":{"query":"// Drawing shapes: `drawable` makes a vector layer editable - sketch polygons with the\n// toolbar pencil (or the layer's drawableController.activateDrawMode(\"polygon\")) and drag\n// their vertices. The platform does not cut or merge shapes on its own: a \"line\" sketch adds\n// a line feature, and overlap rules apply only when your code calls layer.resolveOverlap.\n[\n {\n title: \"Areas of interest\",\n name: \"areas_of_interest\",\n source: \"file\",\n type: \"empty\",\n visibility: true,\n drawable: {\n drawModes: [\"polygon\", \"line\"], // the tools offered by the toolbar pencil\n onDrawingStatusChange: function (detail) {\n console.log(detail.status); // off | ready | drawing | drawing_line | feature_selected | vertex_drag\n },\n },\n },\n];","view":[-62,-26,-36,-2]},"expression-function--two-maps":{"query":"// Two maps in one expression: name lists both maps, and each pixel brings both values - here forest biomass, kept only where the land is low.\n// layersVals follows the order of name: [0] the biomass (t/ha), [1] the elevation (m).\n// A pixel where either map has no data is left out.\n[\n {\n title: \"Lowland forest biomass\",\n name: \"CSR:biomassa_baccini_bioma_am,CSR:altimetria\",\n source: \"calculate\",\n opacity: 0.85,\n visibility: true,\n paramsButtonConfig: [{ type: \"query\", pressed: true }],\n descriptionHtml: \"{{legendhtml}}\",\n beforeCalc: function () {\n this.setCalculateLegend([\n { color: [22, 160, 133], value: 1, title: \"Below 200 m, above 200 t/ha\" },\n { color: [163, 228, 215], value: 2, title: \"Below 200 m, up to 200 t/ha\" },\n ]);\n },\n expression: function (layersVals) {\n var biomass = layersVals[0];\n var elevation = layersVals[1];\n if (!this.isNumeric(biomass) || !this.isNumeric(elevation)) return this.nullValue;\n if (elevation >= 200) return this.nullValue;\n return biomass > 200 ? 1 : 2;\n },\n },\n];","page":"expression-function","title":"Two maps in one expression","summary":"Name lists both maps, and each pixel brings both values - here forest biomass, kept only where the land is low.","view":[-66,-9,-52,1]},"expression-function":{"query":"// Expression: runs once per pixel, in a worker, over the values of the maps in `name`.\n// Here elevation is reclassified into three classes with a legend set in beforeCalc.\n[\n {\n title: \"Elevation classes\",\n name: \"CSR:altimetria\",\n source: \"calculate\",\n opacity: 0.85,\n visibility: true,\n paramsButtonConfig: [{ type: \"query\", pressed: true }],\n descriptionHtml: \"{{legendhtml}}\",\n beforeCalc: function () {\n this.setCalculateLegend([\n { color: [39, 174, 96], value: 1, title: \"Lowlands (below 300 m)\" },\n { color: [241, 196, 15], value: 2, title: \"Uplands (300 - 1000 m)\" },\n { color: [160, 82, 45], value: 3, title: \"Highlands (above 1000 m)\" },\n ]);\n },\n expression: function (layersVals) {\n var elevation = layersVals[0];\n if (!this.isNumeric(elevation)) return this.nullValue;\n return elevation < 300 ? 1 : elevation < 1000 ? 2 : 3;\n },\n },\n];","view":[-74,-34,-34.5,5.5],"variants":["expression-function--two-maps"]},"feature-interaction":{"query":"// Clicking and hovering features: onClick receives the clicked feature (here its attributes\n// are written in the panel) and selectStyle marks it; onHover runs when the pointer enters and\n// leaves a feature (here it names it in the panel) and hoverStyle - which needs an onHover -\n// marks it. The points file ships with the platform. (popupTemplate is accepted but opens\n// nothing: use onClick.)\n[\n {\n title: \"Example points\",\n name: \"example_points\",\n source: \"file\",\n type: \"jsonurl\",\n url: \"/theme/app/data/points_example.json\", // [{\"lon\":-50,\"lat\":-10,\"name\":\"name1\"}, ...]\n coordinates: { x: \"lon\", y: \"lat\" },\n fromProj: \"EPSG:4326\",\n visibility: true,\n paramsButtonConfig: [{ type: \"query\", pressed: true }],\n descriptionHtml:\n \"{{label|id=hovered_point|text=Point at a feature to see its name.}}<br>\" +\n \"{{label|id=clicked_point|text=Click a feature to select it.}}\",\n onClick: function (feature) {\n var point = feature.attributes;\n Ext.getCmp(\"clicked_point\").setText(\"Selected \" + point.name + \": longitude \" + point.lon + \", latitude \" + point.lat);\n },\n onHover: function (feature, entering) {\n var label = Ext.getCmp(\"hovered_point\");\n if (label) label.setText(entering ? \"Pointing at \" + feature.attributes.name : \"Point at a feature to see its name.\");\n },\n defaultStyle: { graphicName: \"circle\", pointRadius: 12, fillColor: \"#2980b9\", fillOpacity: 0.9, strokeColor: \"#ffffff\", strokeWidth: 2 },\n hoverStyle: { pointRadius: 15, fillColor: \"#f39c12\" },\n selectStyle: { pointRadius: 15, fillColor: \"#e74c3c\" },\n },\n];","view":[-74,-13,-46,-1]},"file-source-layer--csv-points":{"query":"// Points from a CSV file: each row becomes a point at its coord_x / coord_y, with the other columns as its attributes, and close points are grouped into clusters.\n// type csv fetches the file at url; coordinates names the two columns; clusterDistance (pixels)\n// groups points closer than that into one symbol, whose count attribute the label shows.\n// Zoom in to split the clusters.\n[\n {\n title: \"Listings from a CSV file\",\n name: \"csv_listings\",\n source: \"file\",\n type: \"csv\",\n url: \"/theme/app/data/teste_csv_points.csv\", // coord_x,coord_y,size,address,price,type,...\n coordinates: { x: \"coord_x\", y: \"coord_y\" },\n fromProj: \"EPSG:4326\",\n clusterDistance: 45,\n visibility: true,\n defaultStyle: {\n graphicName: \"circle\",\n pointRadius: 13,\n fillColor: \"#16a085\",\n fillOpacity: 0.9,\n strokeColor: \"#ffffff\",\n strokeWidth: 2,\n label: \"${count}\", // how many rows the symbol stands for\n fontColor: \"#ffffff\",\n fontSize: \"11px\",\n fontWeight: \"bold\",\n },\n },\n];","page":"file-source-layer","title":"Points from a CSV file","summary":"Each row becomes a point at its coord_x / coord_y, with the other columns as its attributes, and close points are grouped into clusters.","view":[-44.08,-20.06,-43.85,-19.77]},"file-source-layer--geojson-labels":{"query":"// A GeoJSON file, labelled: type geojsonurl loads a GeoJSON file by URL, and ${...} in the style writes an attribute of each feature on the map - here the regions of Belo Horizonte.\n// The file has no crs member, so fromProj says its coordinates are longitude / latitude.\n[\n {\n title: \"Regions of Belo Horizonte\",\n name: \"bh_regions\",\n source: \"file\",\n type: \"geojsonurl\",\n url: \"/theme/app/data/regioes.geojson\", // properties: NOME_REGIO, SIGLA_REGI, ID_REGIONA\n fromProj: \"EPSG:4326\",\n visibility: true,\n defaultStyle: {\n fillColor: \"#8e44ad\",\n fillOpacity: 0.2,\n strokeColor: \"#5b2c6f\",\n strokeWidth: 2,\n label: \"${NOME_REGIO}\",\n fontSize: \"13px\",\n fontWeight: \"bold\",\n fontColor: \"#2c3e50\",\n labelOutlineColor: \"#ffffff\",\n labelOutlineWidth: 3,\n },\n },\n];","page":"file-source-layer","title":"A GeoJSON file, labelled","summary":"Type geojsonurl loads a GeoJSON file by URL, and ${...} in the style writes an attribute of each feature on the map - here the regions of Belo Horizonte.","view":[-44.08,-20.06,-43.85,-19.77]},"file-source-layer":{"query":"// File layer: features from inline GeoJSON (type json). Declare fromProj - GeoJSON without a\n// crs is otherwise read in the platform's default projection and lands in the wrong place.\n[\n {\n title: \"Inline GeoJSON\",\n name: \"inline_areas\",\n source: \"file\",\n type: \"json\",\n fromProj: \"EPSG:4326\",\n visibility: true,\n json: {\n type: \"FeatureCollection\",\n features: [\n { type: \"Feature\", properties: { name: \"Area A\" },\n geometry: { type: \"Polygon\", coordinates: [[[-48, -16], [-44, -16], [-44, -20], [-48, -20], [-48, -16]]] } },\n { type: \"Feature\", properties: { name: \"Area B\" },\n geometry: { type: \"Polygon\", coordinates: [[[-56, -6], [-50, -2], [-50, -10], [-56, -6]]] } },\n { type: \"Feature\", properties: { name: \"Point C\" },\n geometry: { type: \"Point\", coordinates: [-40.5, -12] } },\n ],\n },\n defaultStyle: { fillColor: \"#e67e22\", fillOpacity: 0.5, strokeColor: \"#a84300\", strokeWidth: 2, pointRadius: 8 },\n },\n];","view":[-62,-26,-34,2],"variants":["file-source-layer--csv-points","file-source-layer--geojson-labels"]},"filefield-widget":{"query":"// FileField: a local file picker. Its input value is a getter: inputs.id[ID]() returns the File.\n[\n {\n title: \"Upload a shapefile\",\n name: \"uploaded_shapefile\",\n source: \"file\",\n type: \"empty\",\n visibility: true,\n paramsButtonConfig: [{ type: \"query\", pressed: true }],\n descriptionHtml:\n \"{{label|text=Load a shapefile (.shp) to draw it on the map}}\" +\n \"{{filefield|id=loadshp|fieldLabel=Shapefile (.shp)|_onChange=onSelectFile}}\",\n functions: {\n onSelectFile: function () {\n var file = this.getInputs().id[\"loadshp\"]();\n if (file) {\n ExtjsUtils.GEOJSON.shapefile2GeojsonAsync(file, { layer: this, fromProj: \"EPSG:4326\" });\n }\n },\n },\n },\n];","view":[-74,-34,-34.5,5.5]},"hoverpixel-widget--panel-readout":{"query":"// Values in the panel: as the pointer moves, runOnHover writes the values of two maps under it into a label of the panel - here forest biomass and elevation.\n// With two maps in name, runOnHover receives both values: layerVals[0] and layerVals[1].\n// A place without data comes as an empty value.\n[\n {\n title: \"Biomass and elevation under the pointer\",\n name: \"CSR:biomassa_baccini_bioma_am,CSR:altimetria\",\n source: \"calculate\",\n opacity: 0.75,\n visibility: true,\n paramsButtonConfig: [{ type: \"query\", pressed: true }],\n descriptionHtml:\n \"{{hoverpixel|id=readout_hover|text=Read the maps under the pointer|checked=true|hideLabel=true|runOnHover=showValues}}\" +\n \"{{label|id=readout|text=Move the pointer over the map.}}\",\n functions: {\n showValues: function (layerVals) {\n var label = Ext.getCmp(\"readout\");\n if (!label) return;\n function show(value, unit) {\n return value === null || value === undefined || isNaN(value) ? \"no data\" : Math.round(value) + \" \" + unit;\n }\n label.setText(\"Biomass: \" + show(layerVals[0], \"t/ha\") + \" - elevation: \" + show(layerVals[1], \"m\"));\n },\n },\n expression: function (layersVals) {\n return layersVals[0]; // the map shows the biomass\n },\n },\n];","page":"hoverpixel-widget","title":"Values in the panel","summary":"As the pointer moves, runOnHover writes the values of two maps under it into a label of the panel - here forest biomass and elevation.","view":[-64,-9,-56,-2]},"hoverpixel-widget":{"query":"// Hoverpixel: reads the value of each map under the cursor and passes it to runOnHover\n// (layerVals, inputs, coordinates); this = the layer.\n[\n {\n title: \"Elevation under the cursor\",\n name: \"CSR:altimetria\",\n source: \"calculate\",\n opacity: 0.7,\n visibility: true,\n paramsButtonConfig: [{ type: \"query\", pressed: true }],\n descriptionHtml:\n \"{{hoverpixel|id=elevation_hover|text=Show the elevation under the cursor|checked=true|runOnHover=onHover}}\",\n functions: {\n onHover: function (layerVals, inputs, coordinates) {\n // coordinates come in the map's projection (metres): convert them to degrees to show\n var degrees = coordinates.clone().transform(ExtjsUtils.JS.getMap().getProjectionObject(), new OpenLayers.Projection(\"EPSG:4326\"));\n ExtjsUtils.ALERTIFY.log(\"Elevation: <b>\" + Math.round(layerVals[0]) + \" m</b><br>\" +\n degrees.lat.toFixed(2) + \", \" + degrees.lon.toFixed(2));\n },\n },\n expression: function (layersVals) {\n return layersVals[0];\n },\n },\n];","view":[-74,-34,-34.5,5.5],"variants":["hoverpixel-widget--panel-readout"]},"inputmanager-widget":{"query":"// InputManager: a named bag of values that buttons and callbacks fill; setValues() recalculates\n// the layer. On the page use getValue(); in expression() read the plain values from .global.\n[\n {\n title: \"Vegetation biomass presets\",\n name: \"CSR:bioma_cerrado_biomassa\",\n source: \"calculate\",\n opacity: 0.85,\n visibility: true,\n paramsButtonConfig: [{ type: \"query\", pressed: true }],\n descriptionHtml:\n \"{{inputmanager|id=preset}}\" +\n \"{{button|id=preset_open|text=Open savanna (below 10 t/ha)|handler=showOpen}}\" +\n \"{{button|id=preset_wood|text=Woodland (above 50 t/ha)|handler=showWoodland}}\",\n functions: {\n showOpen: function () {\n this.getInputs().id[\"preset\"].setValues({ min: 0, max: 10, title: \"Open savanna\" });\n },\n showWoodland: function () {\n this.getInputs().id[\"preset\"].setValues({ min: 50, max: 99999, title: \"Woodland\" });\n },\n },\n onInputsReady: function (inputs) {\n inputs.id[\"preset\"].setDefaultValues({ min: 0, max: 10, title: \"Open savanna\" });\n },\n beforeCalc: function (inputs) {\n var preset = inputs.id[\"preset\"];\n this.setCalculateLegend([{ color: [39, 174, 96], value: 1, title: preset.getValue(\"title\") }]);\n },\n expression: function (layersVals, inputs) {\n var range = inputs[0].global; // inputs[0]: the inputmanager - buttons are not inputs\n return layersVals[0] >= range.min && layersVals[0] <= range.max ? 1 : this.nullValue;\n },\n },\n];","view":[-55,-16,-45,-7]},"layer-buttons":{"query":"// Layer panel buttons: paramsButtonConfig chooses the buttons on the layer's row - the query\n// panel (where descriptionHtml lives), download and metadata.\n[\n {\n title: \"Geology\",\n name: \"CSR:geologia\",\n source: \"calculate\",\n opacity: 0.8,\n visibility: true,\n paramsButtonConfig: [\n { type: \"query\", pressed: true, tooltip: \"Show the controls\" },\n { type: \"download\", tooltip: \"Download this map\" },\n { type: \"metadata\", tooltip: \"About this map\" },\n ],\n descriptionHtml: \"{{label|text=The row above holds the layer's buttons: this panel, download and metadata.}}\",\n },\n];","view":[-74,-34,-34.5,5.5]},"legend_opacityslider-widget":{"query":"// LegendHtml and OpacitySlider: the legend of the layer inside its panel, and a slider\n// that controls the layer's opacity.\n[\n {\n title: \"Geology\",\n name: \"CSR:geologia\",\n source: \"calculate\",\n opacity: 0.8,\n visibility: true,\n paramsButtonConfig: [{ type: \"query\", pressed: true }],\n descriptionHtml: \"{{label|text=Opacity}}{{opacityslider}}{{legendhtml}}\",\n },\n];","view":[-74,-34,-34.5,5.5]},"livecomposedsplit-widget":{"query":"// LiveComposedSplit: compare January and August precipitation side by side.\n// Open the layer's panel and press \"Compare months\"; drag the divider across the map.\n[\n {\n title: \"Monthly precipitation\",\n // the same map twice - one copy for each side of the divider\n name: \"CSR:precip_monthly_average,CSR:precip_monthly_average\",\n styles: \"precip_monthly_average_1,precip_monthly_average_8\",\n source: \"calculate\",\n opacity: 0.8,\n visibility: true,\n paramsButtonConfig: [{ type: \"query\", pressed: true }],\n descriptionHtml:\n \"{{livecomposedsplit|id=example_split|text=Compare months\" +\n \"|displayNames=January,April,August,November\" +\n \"|layerNames=precip_monthly_average_1,precip_monthly_average_4,precip_monthly_average_8,precip_monthly_average_11\" +\n \"|baseName=CSR:precip_monthly_average|leftDefault=January|rightDefault=August}}\",\n },\n];"},"loadcsv-widget":{"query":"// LoadCsv: downloads a CSV before the layer calculates; its input value is a CSV table\n// (row 0 = header, getValue(column, line) with line 0 = first data row). Drawn as a chart.\n[\n {\n title: \"Carbon loss by deforestation\",\n name: \"CSR:estados\",\n source: \"calculate\",\n opacity: 0.35,\n visibility: true,\n paramsButtonConfig: [{ type: \"query\", pressed: true }],\n descriptionHtml:\n \"{{loadcsv|id=emissions|url=/theme/app/data/emissoesco2.csv|removeEmptyLines=true}}\" +\n '<div id=\"emissions_chart\" style=\"width:290px;height:210px\"></div>',\n // afterCalc runs once the expression's values are computed, so the layer needs one\n expression: function (layersVals) {\n return layersVals[0];\n },\n afterCalc: function (inputs) {\n var table = inputs.id[\"emissions\"]; // columns: percentage, carbon_loss\n var points = [];\n for (var line = 0; line < table.getLineCount(); line++) {\n points.push([parseFloat(table.getValue(0, line)), parseFloat(table.getValue(1, line)) / 1e9]);\n }\n var old = ExtjsUtils.HIGHCHART.getById(\"emissions_chart\");\n if (old) old.destroy();\n Highcharts.chart(\"emissions_chart\", {\n title: { text: \"Carbon loss (Gt)\" },\n xAxis: { title: { text: \"Forest lost (%)\" } },\n yAxis: { title: { text: null } },\n legend: { enabled: false },\n credits: { enabled: false },\n series: [{ name: \"Carbon loss\", data: points }],\n });\n },\n },\n];","view":[-74,-34,-34.5,5.5]},"loadjson-widget":{"query":"// LoadJson: downloads JSON before the layer calculates; its input value is the parsed object.\n// Here, the area of each geological era, listed in the panel.\n[\n {\n title: \"Geology - area by era\",\n name: \"CSR:geologia\",\n source: \"calculate\",\n opacity: 0.8,\n visibility: true,\n paramsButtonConfig: [{ type: \"query\", pressed: true }],\n descriptionHtml:\n \"{{loadjson|id=areas|url=/theme/app/data/geologia_area.json}}\" +\n '<div id=\"area_list\" style=\"font-size:12px\"></div>',\n // afterCalc runs once the expression's values are computed, so the layer needs one\n expression: function (layersVals) {\n return layersVals[0];\n },\n afterCalc: function (inputs) {\n var areas = inputs.id[\"areas\"]; // { \"Cenozóico\": 4984826.16, ... } in km2\n var rows = Object.keys(areas).sort(function (a, b) { return areas[b] - areas[a]; });\n document.getElementById(\"area_list\").innerHTML = rows.map(function (era) {\n return \"<b>\" + era + \"</b>: \" + ExtjsUtils.NUMBER.abbreviateNumber(areas[era]) + \" km²\";\n }).join(\"<br>\");\n },\n },\n];","view":[-74,-34,-34.5,5.5]},"map-tools":{"query":"// Map toolbar tools and page options are chosen in the page URL, not in the query:\n// /calculator/?queryid=...&tools=legend,measure,getfeature,hovershowlegend,zoomextent,customzoom,metadata,helpintro\n// &options=scale,grid,overview\n[\n { name: \"CSR:estados\", title: \"States\", visibility: true, opacity: 0.5 },\n];","view":[-74,-34,-34.5,5.5]},"mappia-io":{"query":"// MappiaIO, the map side of an embed: the query listens to the page that embeds it\n// (setMappiaIoCallback) and answers it (postMessage). Both sides have buttons: the page's buttons\n// send operations (list, show, add a city) and the panel shows what the page asked; the panel's\n// own button and a click on a city report to the page. The operation names are this example's\n// own - the platform reserves only the ones starting with \"mappia__\". On its own it is an\n// ordinary map; the page side is on the MappiaIO page of the documentation.\nExtjsUtils.QUERY.setQueryGlobalProperties({\n citiesLayer: null, // set by onAdded below; cleared with the query like every global here\n onPageMessage: function (msg) {\n var layer = window.citiesLayer;\n if (!msg || !msg.operation || !layer) return; // not for this query, or not loaded yet\n var said = Ext.getCmp(\"page_said\"); // the panel label: what the page asked last\n if (said) said.setText(\"The page asked: \" + msg.operation + (msg.message && msg.message.name ? \" \" + msg.message.name : \"\"));\n var reply = { requestId: msg.requestId }; // echo the id so the page can match the answer\n if (msg.operation === \"list_cities\") {\n reply.operation = \"cities\";\n reply.message = layer.features.map(function (feature) { return feature.attributes; });\n } else if (msg.operation === \"show_city\") {\n var city = layer.features.filter(function (feature) {\n return feature.attributes.name === msg.message.name;\n })[0];\n if (city) {\n layer.map.setCenter(city.geometry.getBounds().getCenterLonLat(), 7);\n layer.selectController.unselectAll();\n layer.selectController.select(city);\n }\n reply.operation = \"city_shown\";\n reply.message = { name: msg.message.name, found: !!city };\n } else if (msg.operation === \"add_city\") {\n var point = new OpenLayers.Geometry.Point(msg.message.lon, msg.message.lat)\n .transform(new OpenLayers.Projection(\"EPSG:4326\"), layer.map.getProjectionObject());\n layer.addFeatures([new OpenLayers.Feature.Vector(point, { name: msg.message.name, population: msg.message.population })]);\n reply.operation = \"city_added\";\n reply.message = { name: msg.message.name, count: layer.features.length };\n } else {\n reply.operation = \"unknown_operation\";\n reply.message = { operation: msg.operation };\n }\n ExtjsUtils.QUERY.postMessage(reply);\n },\n // map -> page from a button of the panel: {{button|handler=sendViewToPage}} finds it by name\n sendViewToPage: function () {\n var layer = window.citiesLayer;\n var view = layer.map.getExtent();\n var inView = layer.features.filter(function (feature) {\n return view.containsLonLat(feature.geometry.getBounds().getCenterLonLat());\n });\n ExtjsUtils.QUERY.postMessage({\n operation: \"cities_in_view\",\n message: { zoom: layer.map.getZoom(), cities: inView.map(function (feature) { return feature.attributes.name; }) },\n });\n },\n}) &&\n ExtjsUtils.QUERY.setMappiaIoCallback(window.onPageMessage) && [\n {\n title: \"Cities - talking to the page\",\n name: \"mappia_io_cities\",\n source: \"file\",\n type: \"json\",\n fromProj: \"EPSG:4326\",\n visibility: true,\n paramsButtonConfig: [{ type: \"query\", pressed: true }],\n descriptionHtml:\n \"{{label|id=page_said|text=Waiting for the page to send something.}}<br>\" +\n \"{{button|id=send_view|text=Send the cities in view to the page|handler=sendViewToPage}}\",\n json: {\n type: \"FeatureCollection\",\n features: [\n [\"Sao Paulo\", -46.63, -23.55, 11451999],\n [\"Rio de Janeiro\", -43.2, -22.91, 6211423],\n [\"Brasilia\", -47.88, -15.79, 2817381],\n [\"Fortaleza\", -38.54, -3.73, 2428708],\n [\"Salvador\", -38.5, -12.97, 2417678],\n [\"Belo Horizonte\", -43.94, -19.92, 2315560],\n [\"Manaus\", -60.02, -3.12, 2063689],\n [\"Curitiba\", -49.27, -25.43, 1773718],\n ].map(function (city) {\n return {\n type: \"Feature\",\n properties: { name: city[0], population: city[3] },\n geometry: { type: \"Point\", coordinates: [city[1], city[2]] },\n };\n }),\n },\n defaultStyle: { graphicName: \"circle\", pointRadius: 9, fillColor: \"#277cea\", fillOpacity: 0.9, strokeColor: \"#ffffff\", strokeWidth: 2 },\n selectStyle: { pointRadius: 12, fillColor: \"#e74c3c\" },\n onAdded: function (event) {\n window.citiesLayer = (event && event.layer) || this;\n },\n // map -> page: tell the embedding page which city the user clicked\n onClick: function (feature) {\n ExtjsUtils.QUERY.postMessage({\n operation: \"city_clicked\",\n message: { name: feature.attributes.name, population: feature.attributes.population },\n });\n },\n },\n ];","view":[-65,-30,-34,0]},"markup-syntax":{"query":"// Markup syntax: plain HTML around widgets; numbers become numbers, JSON lists are parsed,\n// html= is taken verbatim (no escaping needed), and param=false switches a flag off.\n[\n {\n title: \"Markup syntax\",\n name: \"CSR:estados\",\n source: \"calculate\",\n opacity: 0.6,\n visibility: true,\n paramsButtonConfig: [{ type: \"query\", pressed: true }],\n descriptionHtml:\n \"<b>Plain HTML</b> sits next to the widgets.<br>\" +\n \"{{label|html=A label with <i>raw HTML</i> and a = sign, no escaping}}\" +\n \"{{textfield|id=amount|fieldLabel=A number|value=42|isnumeric=true}}\" +\n '{{combobox|id=choice|fieldLabel=From a JSON list|editable=false|data=[[\"First\"],[\"Second\"]]}}',\n },\n];","view":[-74,-34,-34.5,5.5]},"notifications":{"query":"// Notifications and choices: log (a passing message), alert (non-blocking) and\n// confirmChoice (a choice between labelled options).\n[\n {\n title: \"States\",\n name: \"CSR:estados\",\n source: \"calculate\",\n opacity: 0.6,\n visibility: true,\n paramsButtonConfig: [{ type: \"query\", pressed: true }],\n descriptionHtml: \"{{button|id=ask_user|text=Choose a region|handler=askRegion}}\",\n functions: {\n askRegion: function () {\n ExtjsUtils.ALERTIFY.confirmChoice(\n \"Which region should the map focus on?\",\n [\n { label: \"North\", value: \"N\" },\n { label: \"Northeast\", value: \"NE\" },\n { label: \"Southeast\", value: \"SE\" },\n ],\n function (value) {\n ExtjsUtils.ALERTIFY.log(\"You picked \" + value);\n }\n );\n },\n },\n },\n];","view":[-74,-34,-34.5,5.5]},"offline-areas":{"query":"// Offline areas: ExtjsUtils.OFFLINE downloads an area's tiles for use without a connection.\n// Estimating first costs nothing - it only counts the tiles of the chosen layers and zooms.\n[\n {\n title: \"Offline areas\",\n name: \"CSR:estados\",\n source: \"calculate\",\n opacity: 0.5,\n visibility: true,\n paramsButtonConfig: [{ type: \"query\", pressed: true }],\n descriptionHtml:\n \"{{button|id=estimate_area|text=How many tiles is this view?|handler=estimate}}\" +\n \"{{label|id=estimate_label|text=Press the button to estimate.}}\",\n functions: {\n estimate: function () {\n var map = ExtjsUtils.JS.getMap();\n var zoom = map.getZoom();\n var layers = ExtjsUtils.OFFLINE.getCacheableLayers();\n var tiles = ExtjsUtils.OFFLINE.estimateTileCountForLayers(map.getExtent(), zoom, zoom + 2, layers);\n Ext.getCmp(\"estimate_label\").setText(\n \"This view at zoom \" + zoom + \"-\" + (zoom + 2) + \": \" + tiles + \" tiles for \" + layers.length + \" layer(s).\"\n );\n },\n },\n },\n];","view":[-74,-34,-34.5,5.5]},"overlay-layer":{"query":"// Overlay layer: Ext.LayerAdditional draws markers and highlights without adding a row to the\n// layer panel. runNow is the one global the platform calls itself, once, after loading.\nExtjsUtils.QUERY.setQueryGlobalProperties({\n runNow: function () {\n var overlay = new Ext.LayerAdditional({}, ExtjsUtils.JS.getMap());\n var city = overlay.createFeature(overlay.createPoint(-43.94, -19.92, \"EPSG:4326\")); // Belo Horizonte\n overlay.drawFeature(city, { graphicName: \"circle\", pointRadius: 11, fillColor: \"#e74c3c\", fillOpacity: 1, strokeColor: \"#ffffff\", strokeWidth: 3 });\n },\n}) && [\n { name: \"CSR:estados\", title: \"States\", visibility: true, opacity: 0.4 },\n];","view":[-60,-30,-36,-10]},"pickpoint-widget":{"query":"// PickPoint: click the map to pick a feature; onMark receives the attributes of every map at\n// that point (evt.features[mapIndex][i].data). onefeature keeps a single picked point.\n[\n {\n title: \"Pick a state\",\n name: \"CSR:estados\",\n source: \"calculate\",\n opacity: 0.6,\n visibility: true,\n paramsButtonConfig: [{ type: \"query\", pressed: true }],\n descriptionHtml:\n \"{{pickpoint|id=pick_state|text=Click a state on the map|checked=true|onefeature=true|geometryColor=#27ae60|onMark=onPicked}}\",\n functions: {\n onPicked: function (evt) {\n var feature = evt.features && evt.features[0] && evt.features[0][0];\n if (!feature) return;\n var data = feature.data;\n ExtjsUtils.ALERTIFY.log(Object.keys(data).slice(0, 4).map(function (key) {\n return \"<b>\" + key + \"</b>: \" + data[key];\n }).join(\"<br>\"));\n },\n },\n },\n];","view":[-60,-30,-36,-10]},"range-slider-widget":{"query":"// Range slider: two thumbs (values=[low, high]); the slider's value is the [low, high] pair.\n// Here it keeps the places whose average annual rainfall falls inside the band.\n[\n {\n title: \"Rainfall band\",\n name: \"CSR:precip_annual_average\",\n source: \"calculate\",\n opacity: 0.85,\n visibility: true,\n paramsButtonConfig: [{ type: \"query\", pressed: true }],\n descriptionHtml:\n \"{{label|text=Annual rainfall (mm)}}\" +\n \"{{slider|id=band|minValue=300|maxValue=2100|increment=50|values=[800,1100]|width=250}}\",\n beforeCalc: function (inputs) {\n var band = inputs.id[\"band\"];\n this.setCalculateLegend([\n { color: [41, 128, 185], value: 1, title: \"Between \" + band[0] + \" and \" + band[1] + \" mm\" },\n ]);\n },\n expression: function (layersVals, inputs) {\n var band = inputs[0]; // [low, high]\n return layersVals[0] >= band[0] && layersVals[0] <= band[1] ? 1 : this.nullValue;\n },\n },\n];","view":[31,-27,41,-10]},"slider-widget--coloured-track":{"query":"// Coloured track: the slider's track is painted with colours by value, so the reader sees what each position means before moving it.\n// backgroundColors paints the track from each startValue on, and gradient=true blends one colour\n// into the next. The layer keeps the land higher than the chosen elevation.\n[\n {\n title: \"Land above an elevation\",\n name: \"CSR:altimetria\",\n source: \"calculate\",\n opacity: 0.85,\n visibility: true,\n paramsButtonConfig: [{ type: \"query\", pressed: true }],\n descriptionHtml:\n \"{{label|text=Minimum elevation (m)}}\" +\n \"{{slider|id=minimum|minValue=0|maxValue=2000|increment=100|value=800|width=250|gradient=true\" +\n '|backgroundColors=[{color: \"#2e7d32\", startValue: 0}, {color: \"#f9a825\", startValue: 700}, {color: \"#8d4925\", startValue: 1400}]}}',\n beforeCalc: function (inputs) {\n this.setCalculateLegend([\n { color: [141, 73, 37], value: 1, title: \"Above \" + inputs.id[\"minimum\"] + \" m\" },\n ]);\n },\n expression: function (layersVals, inputs) {\n return layersVals[0] >= inputs[0] ? 1 : this.nullValue;\n },\n },\n];","page":"slider-widget","title":"Coloured track","summary":"The slider's track is painted with colours by value, so the reader sees what each position means before moving it.","view":[-48,-23.5,-41,-17]},"slider-widget--two-sliders":{"query":"// Two sliders, two maps: one slider per map, and the layer keeps the places that pass both - here land that is both high and steep, in the Cerrado.\n// name lists both maps, so each pixel brings two values: layersVals[0] is the elevation and\n// layersVals[1] the slope. The sliders are inputs[0] and inputs[1], in the order they appear.\n[\n {\n title: \"High and steep land\",\n name: \"CSR:altimetria,CSR:bioma_cerrado_declividade\",\n source: \"calculate\",\n opacity: 0.9,\n visibility: true,\n paramsButtonConfig: [{ type: \"query\", pressed: true }],\n descriptionHtml:\n \"{{label|text=Elevation above (m)}}\" +\n \"{{slider|id=min_elevation|minValue=0|maxValue=1600|increment=100|value=800|width=250}}\" +\n \"{{label|text=Slope above (degrees)}}\" +\n \"{{slider|id=min_slope|minValue=0|maxValue=40|increment=5|value=10|width=250}}\",\n beforeCalc: function (inputs) {\n this.setCalculateLegend([\n {\n color: [192, 57, 43],\n value: 1,\n title: \"Above \" + inputs.id[\"min_elevation\"] + \" m, steeper than \" + inputs.id[\"min_slope\"] + \" degrees\",\n },\n ]);\n },\n expression: function (layersVals, inputs) {\n return layersVals[0] >= inputs[0] && layersVals[1] >= inputs[1] ? 1 : this.nullValue;\n },\n },\n];","page":"slider-widget","title":"Two sliders, two maps","summary":"One slider per map, and the layer keeps the places that pass both - here land that is both high and steep, in the Cerrado.","view":[-49.5,-17.5,-46,-13]},"slider-widget":{"query":"// Slider and Label: show only the forest carbon stock above the value chosen on the slider.\n// beforeCalc runs on the page (inputs.id works there); expression runs in a worker\n// (inputs is a plain array there: inputs[0] is the first input widget, the slider).\n[\n {\n title: \"Carbon stock above a threshold\",\n name: \"CSR:biomassa_inv_br_redd\",\n source: \"calculate\",\n opacity: 0.85,\n visibility: true,\n paramsButtonConfig: [{ type: \"query\", pressed: true }],\n descriptionHtml:\n \"{{label|text=Minimum carbon stock (tC/ha)}}\" +\n \"{{slider|id=threshold|minValue=0|maxValue=300|increment=25|value=150|width=250}}\",\n beforeCalc: function (inputs) {\n this.setCalculateLegend([\n { color: [30, 132, 73], value: 1, title: \"Above \" + inputs.id[\"threshold\"] + \" tC/ha\" },\n ]);\n },\n expression: function (layersVals, inputs) {\n return layersVals[0] >= inputs[0] ? 1 : this.nullValue;\n },\n },\n];","view":[-70,-11,-52,2],"variants":["slider-widget--coloured-track","slider-widget--two-sliders"]},"summedarea-widget":{"query":"// SummedArea: draw a polygon (double-click to close); runOnClick receives one sum per map in\n// `name`. The same raw map is read twice: as average density and as covered area.\n[\n {\n title: \"Population density - area sum\",\n name: \"CSR:pop_density_estimate_2015,CSR:pop_density_estimate_2015\",\n styles: \"1,1\",\n source: \"calculate\",\n operation: \"average,area\",\n opacity: 0.7,\n visibility: true,\n paramsButtonConfig: [{ type: \"query\", pressed: true }],\n descriptionHtml:\n \"{{summedarea|id=area_sum|text=Draw an area to sum|runOnClick=onAreaSummed}}\",\n functions: {\n onAreaSummed: function (layersValues) {\n ExtjsUtils.ALERTIFY.log(\"Area with data: <b>\" +\n ExtjsUtils.NUMBER.abbreviateNumber(Math.round(layersValues[1] / 100)) + \" km²</b>\");\n },\n },\n expression: function (layersVals) {\n return layersVals[0];\n },\n },\n];","view":[-74,-34,-34.5,5.5]},"textfield-widget":{"query":"// Textfield: type the minimum slope. isnumeric only validates - the value is still a string.\n[\n {\n title: \"Slopes steeper than a typed value\",\n name: \"CSR:bioma_cerrado_declividade\",\n source: \"calculate\",\n opacity: 0.9,\n visibility: true,\n paramsButtonConfig: [{ type: \"query\", pressed: true }],\n descriptionHtml:\n \"{{textfield|id=minimum|fieldLabel=Min. slope (°)|value=15|isnumeric=true}}\",\n beforeCalc: function (inputs) {\n this.setCalculateLegend([\n { color: [211, 84, 0], value: 1, title: \"Steeper than \" + inputs.id[\"minimum\"] + \" degrees\" },\n ]);\n },\n expression: function (layersVals, inputs) {\n return layersVals[0] >= parseFloat(inputs[0]) ? 1 : this.nullValue;\n },\n },\n];","view":[-50,-20,-43,-13]},"timeline-panel":{"query":"// Timeline: each step pairs a value with a style of the layer's map; playing the timeline\n// switches the style, and the input holds the current step's value.\n[\n {\n title: \"Land use 1992 - 2015\",\n name: \"CSR:land_use_1992_2015\",\n source: \"calculate\",\n opacity: 0.85,\n visibility: true,\n paramsButtonConfig: [{ type: \"query\", pressed: true }],\n descriptionHtml:\n \"{{timeline|id=land_use_years|nextStepInterval=1500\" +\n '|steps=[[1992, \"land_use_1992_2015_1\"], [2000, \"land_use_1992_2015_9\"], ' +\n '[2008, \"land_use_1992_2015_17\"], [2015, \"land_use_1992_2015_24\"]]}}',\n },\n];","view":[28,-28,43,-9]},"window-widget":{"query":"// Window: a floating window plus the button that opens and closes it. The tag renders as the\n// button; startVisible=true opens the window when the layer loads.\n[\n {\n title: \"States\",\n name: \"CSR:estados\",\n source: \"calculate\",\n opacity: 0.6,\n visibility: true,\n paramsButtonConfig: [{ type: \"query\", pressed: true }],\n descriptionHtml:\n \"{{window|id=about_window|title=About this map|text=About this map|startVisible=true\" +\n \"|width=340|height=170|x=380|y=90\" +\n \"|html=<p style='padding:10px'>Brazilian states. A window can hold text, a chart or extra controls that do not fit in the panel.</p>}}\",\n },\n];","view":[-74,-34,-34.5,5.5]},"xyz-layer":{"query":"// XYZ layer: tiles addressed by zoom/column/row; ${z}, ${x} and ${y} are replaced per tile.\n[\n {\n title: \"OpenTopoMap\",\n name: \"opentopomap\",\n source: \"xyz\",\n url: \"https://a.tile.opentopomap.org/${z}/${x}/${y}.png\",\n visibility: true,\n opacity: 0.9,\n },\n];","view":[-47,-23.5,-41,-18.5]},"zoomlevel-widget":{"query":"// ZoomLevel: renders nothing; it hands the map zoom to the layer and recalculates when the\n// zoom changes. Here beforeCalc writes it into a label.\n[\n {\n title: \"Zoom-aware layer\",\n name: \"CSR:altimetria\",\n source: \"calculate\",\n opacity: 0.85,\n visibility: true,\n paramsButtonConfig: [{ type: \"query\", pressed: true }],\n descriptionHtml: \"{{zoomlevel|id=z}}{{label|id=zoom_label|text=Zoom level: ...}}\",\n beforeCalc: function (inputs) {\n var label = Ext.getCmp(\"zoom_label\");\n if (label) label.setText(\"Zoom level: \" + inputs.id[\"z\"] + \" - zoom in for full detail\");\n },\n expression: function (layersVals, inputs) {\n // coarse 500 m classes when zoomed out, full detail when zoomed in\n return inputs[0] < 7 ? Math.round(layersVals[0] / 500) * 500 : layersVals[0];\n },\n },\n];","view":[-74,-34,-34.5,5.5]},"tutorial-01-first-map":{"query":"// Your first map: the whole query is one array with one layer definition - a published map, by its name.\n// A Mappia query is a single JavaScript expression; its value is the list of layers to show.\n[\n {\n name: \"CSR:estados\", // which published map: workspace CSR, map \"estados\" (the states of Brazil)\n title: \"States of Brazil\", // what the layer list shows\n visibility: true, // drawn as soon as the map opens\n },\n];","page":"tutorial","title":"Your first map","summary":"The whole query is one array with one layer definition - a published map, by its name.","view":[-74,-34,-34.5,5.5]},"tutorial-02-layers":{"query":"// Several layers: three maps in one query, each with its own title, opacity and starting state.\n// Every entry of the array is one layer. visibility: false keeps a layer listed but off -\n// the reader turns it on in the layer list. opacity goes from 0 (invisible) to 1.\n[\n {\n name: \"CSR:altimetria\",\n title: \"Elevation\",\n visibility: true,\n opacity: 0.8,\n },\n {\n name: \"CSR:estados\",\n title: \"States\",\n visibility: true,\n opacity: 0.5,\n },\n {\n name: \"CSR:biomassa_baccini_bioma_am\",\n title: \"Forest biomass (Amazon) - turn it on\",\n visibility: false,\n },\n];","page":"tutorial","title":"Several layers","summary":"Three maps in one query, each with its own title, opacity and starting state.","view":[-74,-34,-34.5,5.5]},"tutorial-03-other-servers":{"query":"// Maps from another server: addRemoteWMSServer registers a WMS server under a name of your choice, and each layer names it in source - here INPE's deforestation monitoring (PRODES).\n// The server is TerraBrasilis, INPE's map server; this address is its \"prodes-legal-amz\" workspace,\n// whose catalogue is small and quick to read. The registration comes first in the && chain, so\n// the server is known when the layers are read. Layers without source still come from Mappia.\nExtjsUtils.QUERY.addRemoteWMSServer({\n prodes: {\n url: \"https://terrabrasilis.dpi.inpe.br/geoserver/prodes-legal-amz/ows?\",\n },\n}) && [\n {\n name: \"brazilian_legal_amazon\",\n source: \"prodes\",\n title: \"Legal Amazon (INPE)\",\n visibility: true,\n opacity: 0.5,\n },\n {\n name: \"yearly_deforestation\",\n source: \"prodes\",\n title: \"Deforestation since 2008 (INPE)\",\n visibility: true,\n },\n {\n name: \"CSR:estados\", // from the Mappia catalogue, as before\n title: \"States\",\n visibility: true,\n opacity: 0.4,\n },\n];","page":"tutorial","title":"Maps from another server","summary":"AddRemoteWMSServer registers a WMS server under a name of your choice, and each layer names it in source - here INPE's deforestation monitoring (PRODES).","view":[-74,-17,-44,6]},"tutorial-04-source-types":{"query":"// Four kinds of source: a tile service (xyz), a published map (the default source), a calculated map (calculate) and features from a file (file), in one map.\n// source says where a layer's pixels come from; the other properties of the layer depend on it.\n[\n {\n title: \"Terrain (xyz tiles)\",\n name: \"opentopomap\",\n source: \"xyz\", // a tile service: ${z}, ${x} and ${y} are replaced for every tile\n url: \"https://a.tile.opentopomap.org/${z}/${x}/${y}.png\",\n visibility: true,\n opacity: 0.5,\n },\n {\n title: \"States (published map)\",\n name: \"CSR:estados\", // no source: a map of the catalogue, drawn by the map server\n visibility: true,\n opacity: 0.4,\n },\n {\n title: \"Highlands (calculated)\",\n name: \"CSR:altimetria\",\n source: \"calculate\", // the browser computes a new map from the values of the maps in name\n visibility: true,\n opacity: 0.8,\n beforeCalc: function () {\n this.setCalculateLegend([{ color: [160, 82, 45], value: 1, title: \"Above 1000 m\" }]);\n },\n expression: function (layersVals) {\n return layersVals[0] > 1000 ? 1 : this.nullValue;\n },\n },\n {\n title: \"Two cities (file)\",\n name: \"two_cities\",\n source: \"file\", // vector features: here written in the query (type json), in longitude / latitude\n type: \"json\",\n fromProj: \"EPSG:4326\",\n visibility: true,\n json: {\n type: \"FeatureCollection\",\n features: [\n { type: \"Feature\", properties: { name: \"Belo Horizonte\" }, geometry: { type: \"Point\", coordinates: [-43.94, -19.92] } },\n { type: \"Feature\", properties: { name: \"Brasilia\" }, geometry: { type: \"Point\", coordinates: [-47.88, -15.79] } },\n ],\n },\n defaultStyle: {\n graphicName: \"circle\",\n pointRadius: 9,\n fillColor: \"#e74c3c\",\n strokeColor: \"#ffffff\",\n strokeWidth: 2,\n label: \"${name}\", // an attribute of each feature, written on the map\n labelYOffset: -18,\n fontWeight: \"bold\",\n labelOutlineColor: \"#ffffff\",\n labelOutlineWidth: 3,\n },\n },\n];","page":"tutorial","title":"Four kinds of source","summary":"A tile service (xyz), a published map (the default source), a calculated map (calculate) and features from a file (file), in one map.","view":[-52,-24,-38,-12]},"tutorial-05-calculated-map":{"query":"// A calculated map with a control: a slider feeds the expression, and moving it computes the map again.\n// beforeCalc runs on the page before each calculation: there the inputs are read by id.\n// expression runs in a separate worker, once per pixel: there the inputs are read by position\n// (inputs[0] is the first input in descriptionHtml) - see the execution model.\n[\n {\n title: \"Land above an elevation\",\n name: \"CSR:altimetria\",\n source: \"calculate\",\n visibility: true,\n opacity: 0.85,\n paramsButtonConfig: [{ type: \"query\", pressed: true }], // the panel with the controls starts open\n descriptionHtml:\n \"{{label|text=Minimum elevation (m)}}\" +\n \"{{slider|id=minimum|minValue=0|maxValue=2000|increment=100|value=1000|width=250}}\",\n beforeCalc: function (inputs) {\n this.setCalculateLegend([\n { color: [192, 57, 43], value: 1, title: \"Above \" + inputs.id[\"minimum\"] + \" m\" },\n ]);\n },\n expression: function (layersVals, inputs) {\n return layersVals[0] >= inputs[0] ? 1 : this.nullValue;\n },\n },\n];","page":"tutorial","title":"A calculated map with a control","summary":"A slider feeds the expression, and moving it computes the map again.","view":[-52,-25,-40,-14]},"tutorial-06-groups":{"query":"// Groups: a group with a title becomes an entry of the top menu, where the reader finds its layers, and a viewTitle group becomes a heading in the layer panel.\n// elements holds what is inside a group (layers or more groups); defaultProperties is shared by\n// every layer inside, and a layer that sets a property itself keeps its own value. The panel\n// lists the layers that are on; the top menu lists them all, to turn on.\n[\n {\n title: \"Relief\", // an entry of the top menu\n color: \"#8d4925\",\n elements: [\n {\n viewTitle: \"Terrain\", // a heading in the layer panel\n openGroup: true,\n defaultProperties: { visibility: false, opacity: 0.7 },\n elements: [\n { title: \"Elevation\", name: \"CSR:altimetria\", visibility: true },\n { title: \"Slope (Cerrado)\", name: \"CSR:bioma_cerrado_declividade\" },\n ],\n },\n ],\n },\n {\n title: \"Boundaries\",\n color: \"#2c3e50\",\n elements: [\n { title: \"States\", name: \"CSR:estados\", visibility: true, opacity: 0.5 },\n ],\n },\n];","page":"tutorial","title":"Groups","summary":"A group with a title becomes an entry of the top menu, where the reader finds its layers, and a viewTitle group becomes a heading in the layer panel.","view":[-74,-34,-34.5,5.5]},"tutorial-07-globals-and-functions":{"query":"// Globals and functions: setQueryGlobalProperties declares the names the query shares, runNow runs once when the query is applied, and buttons call functions by name.\n// A query is one expression, so it cannot declare variables with var: setQueryGlobalProperties\n// puts each key on window while this query is applied, and returns true, so the && chain goes on\n// to the layers. A button's handler is looked up in the layer's functions first (this = the\n// layer), then among the globals.\nExtjsUtils.QUERY.setQueryGlobalProperties({\n CAPITAL: { name: \"Brasilia\", lon: -47.88, lat: -15.79 },\n // the one name the platform calls by itself, once, after the globals are in place\n runNow: function () {\n ExtjsUtils.ALERTIFY.log(\"The query is applied - press the buttons in the panel.\");\n },\n goToCapital: function () {\n var map = ExtjsUtils.JS.getMap();\n var center = new OpenLayers.LonLat(CAPITAL.lon, CAPITAL.lat)\n .transform(new OpenLayers.Projection(\"EPSG:4326\"), map.getProjectionObject());\n map.setCenter(center, 9);\n ExtjsUtils.ALERTIFY.log(\"Here is \" + CAPITAL.name + \".\");\n },\n}) && [\n {\n title: \"States\",\n name: \"CSR:estados\",\n source: \"calculate\", // a calculated layer without expression shows the map as it is - and has a panel for the buttons\n visibility: true,\n opacity: 0.5,\n paramsButtonConfig: [{ type: \"query\", pressed: true }],\n descriptionHtml:\n \"{{button|id=go_capital|text=Go to the capital|handler=goToCapital}}\" + // a global function\n \"{{button|id=which_layer|text=Which layer is this?|handler=sayTitle}}\", // a function of the layer\n functions: {\n sayTitle: function () {\n ExtjsUtils.ALERTIFY.log(\"This button belongs to the layer \\\"\" + this.title + \"\\\".\");\n },\n },\n },\n];","page":"tutorial","title":"Globals and functions","summary":"SetQueryGlobalProperties declares the names the query shares, runNow runs once when the query is applied, and buttons call functions by name.","view":[-74,-34,-34.5,5.5]},"tutorial-08-extjsutils":{"query":"// The ExtjsUtils toolbox: the platform's helpers your code calls - here to talk to the reader, read a layer's legend and move the map.\n// ExtjsUtils.ALERTIFY shows messages and questions, ExtjsUtils.LAYER reads layers and legends,\n// ExtjsUtils.JS.getMap() is the map itself (OpenLayers), ExtjsUtils.QUERY applies, adds and\n// removes layers. The API reference lists every helper of each group.\nExtjsUtils.QUERY.setQueryGlobalProperties({\n REGIONS: {\n North: [-74, -10, -46, 5],\n Northeast: [-48, -18, -34, -1],\n South: [-58, -34, -47, -22],\n },\n}) && [\n {\n title: \"Elevation\",\n name: \"CSR:altimetria\",\n source: \"calculate\",\n visibility: true,\n opacity: 0.8,\n paramsButtonConfig: [{ type: \"query\", pressed: true }],\n descriptionHtml:\n \"{{button|id=read_legend|text=Read the legend|handler=readLegend}}\" +\n \"{{button|id=choose_region|text=Go to a region|handler=chooseRegion}}\",\n functions: {\n readLegend: function () {\n var entries = ExtjsUtils.LAYER.getLayerLegend(this, 0) // the legend of this layer's first map\n .filter(function (entry) { return String(entry.title).trim().toLowerCase() !== \"null\"; }); // without the no-data class\n ExtjsUtils.ALERTIFY.log(\"<b>\" + entries.length + \" classes</b>, from \" +\n entries[0].title + \" to \" + entries[entries.length - 1].title + \".\");\n },\n chooseRegion: function () {\n ExtjsUtils.ALERTIFY.confirmChoice(\n \"Which region should the map show?\",\n Object.keys(REGIONS).map(function (name) { return { label: name, value: name }; }),\n function (name) {\n var map = ExtjsUtils.JS.getMap();\n var box = REGIONS[name];\n map.zoomToExtent(new OpenLayers.Bounds(box[0], box[1], box[2], box[3])\n .transform(new OpenLayers.Projection(\"EPSG:4326\"), map.getProjectionObject()));\n }\n );\n },\n },\n },\n];","page":"tutorial","title":"The ExtjsUtils toolbox","summary":"The platform's helpers your code calls - here to talk to the reader, read a layer's legend and move the map.","view":[-56,-25,-40,-12]}}{"parse":[{"match":"^The query is empty","message":"The query is empty. A query is a list of layers: it needs at least [ and ]."},{"match":"is not complete|still open","message":"The query is not complete: a ], } or quote is still open. Every [ needs its ], every { its }."},{"match":"^Unexpected token","where":"end","message":"The query is not complete: a ], } or quote is still open. Every [ needs its ], every { its }."},{"match":"^Unexpected (token|keyword)","token":"^(var|let|const|function|if|for|while|return)$","message":"Line {line}: a query is one expression - the list of layers - so it cannot contain a statement like `{token} ...;`. Values shared by the query are declared with setQueryGlobalProperties, joined to the list with &&."},{"match":"^Unexpected token","token":"^[\\]})]$","where":"line-start","message":"Line {line} closes with {token}, but something above is not closed the same way. Check that every { has its } and every [ its ], in that order."},{"match":"^Unexpected token","where":"line-start","message":"Something is missing at the end of line {prevLine} - often a comma. Each property, and each layer { }, ends with a comma."},{"match":"^Unexpected token","token":"^;$","message":"Line {line}: inside { } a property ends with a comma, not a semicolon."},{"match":"^Unexpected token","token":"^[\\]})]$","message":"Line {line}: this {token} does not match an opening bracket - one too many here, or one missing before it."},{"match":"^Unexpected token","message":"Line {line}, near `{token}`: this is not valid here. Text needs quotes (\"like this\"), and each property ends with a comma."},{"match":"^Unexpected character '(?<char>[“”‘’])'","message":"Line {line}: curly quotes ({char}) come from word processors. Type straight quotes (\") instead."},{"match":"^Unexpected character '(?<char>.+)'","message":"Line {line}: the character {char} is not allowed here."},{"match":"^Unterminated string constant","message":"Line {line}: a text has no closing quote. Add the \" at its end."},{"match":"^Unterminated comment","message":"Line {line}: a /* comment is never closed with */."},{"match":"^Identifier directly after number","message":"Line {line}: a number is followed by letters. A number has digits only (0.5); text goes in quotes."},{"match":"^Shorthand property assignments","message":"Line {line}: write a colon between a property and its value (title: \"States\"), not an equals sign."},{"match":"^Unexpected keyword '(?<word>[^']+)'","message":"Line {line}: `{word}` is a reserved word of JavaScript and cannot be used here."},{"match":"^(?<original>.+)$","message":"Line {line}: the query is not valid JavaScript here ({original})."}],"runtime":[{"match":"^ReferenceError: (?<name>True|False|TRUE|FALSE|Null|NULL) is not defined","message":"Line {line}: JavaScript only knows true, false and null in lower case - `{name}` is not one of them."},{"match":"^ReferenceError: (?<name>[\\w$]+) is not defined","message":"Line {line}: `{name}` is not a value Mappia knows. Text needs quotes (\"{name}\"); a name shared by the query must be declared before the list, with setQueryGlobalProperties."},{"match":"^TypeError: [\\w$.]*\\.map is not a function|is not iterable","message":"The query must end with the list of layers [ ... ]. In an && chain, the last part is the list."},{"match":"^TypeError: (?:[\\w$]+\\.)*(?<name>[\\w$]+) is not a function","message":"Line {line}: `{name}` is not a function Mappia has. Check its spelling - the API reference lists them."},{"match":"^TypeError: Cannot read propert(y|ies) (of (undefined|null) )?\\(?reading '(?<name>[^']+)'\\)?","message":"Line {line}: the query reads `{name}` from something that does not exist (yet)."},{"match":"^(?<original>.+)$","message":"The map could not run the query: {original}"}],"warnings":[{"match":"Could not create layer record for layer '(?<typed>[^']+)'","message":"There is no map called {typed} in the catalogue - check its spelling."},{"match":"^Error loading Source: (?<name>.+)$","message":"The map server \"{name}\" did not answer - this is not your mistake. Press Run again in a moment."},{"match":"^Source (?<name>.+) will be ignored$","message":"The layers of the server \"{name}\" are left out because it did not answer."}]} A complete page
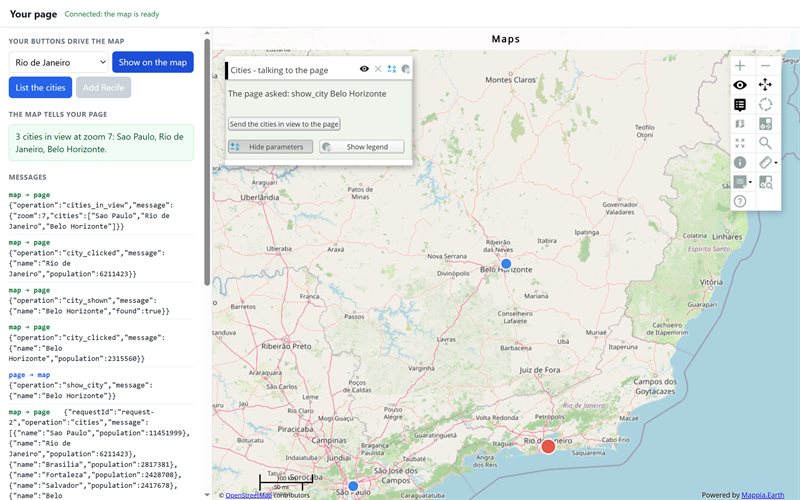
The page in the picture above is one HTML file you can copy and open as it is. Its parts, in the order a page needs them:
- The map and the library: an
<iframe>with the calculator, andmappia_io.jsfrom the map server. - The connection:
MappiaIO("mappia", true)-truebecause the page keeps talking to the map after the start-up. - The page’s buttons call
send(show a city, add one) orask- asendwith arequestIdthat resolves when the map answers with the same id (list the cities). - One
addOnMessageCallbackhandles everything the map says: the answers toask, the city the user clicked, the cities the panel’s button reported, andmappia__queryApplied, which enables the buttons. addReadyCallbackapplies the query -applyQueryFromUrl("cities-query.js"), a file next to the page - as soon as the map listens.
The map side is the MappiaIO example of the playground: a query that registers its listener with ExtjsUtils.QUERY.setMappiaIoCallback, answers with ExtjsUtils.QUERY.postMessage, and has its own button in the panel.
The whole page - host-page.html (193 lines)
<!doctype html>
<html lang="en">
<head>
<meta charset="utf-8">
<meta name="viewport" content="width=device-width, initial-scale=1">
<title>Your page, with a Mappia map in it</title>
<style>
  * { box-sizing: border-box; }
  html, body { height: 100%; margin: 0; }
  body {
    display: flex; flex-direction: column;
    font: 14px/1.45 system-ui, -apple-system, "Segoe UI", Roboto, Arial, sans-serif;
    color: #1f2430; background: #f4f5f7;
  }
  header {
    display: flex; align-items: center; gap: 12px;
    padding: 10px 16px; background: #fff; border-bottom: 1px solid #dfe3e8;
  }
  header h1 { margin: 0; font-size: 16px; }
  #status { font-size: 12px; color: #6b7280; }
  #status.ready { color: #15803d; }
  main { flex: 1; display: flex; min-height: 0; }
  aside {
    width: 340px; flex: none; overflow-y: auto;
    padding: 14px; background: #fff; border-right: 1px solid #dfe3e8;
  }
  section { margin-bottom: 18px; }
  h2 { margin: 0 0 8px; font-size: 11px; letter-spacing: .05em; text-transform: uppercase; color: #6b7280; }
  .row { display: flex; gap: 6px; margin-bottom: 6px; }
  select { flex: 1; min-width: 0; padding: 6px; border: 1px solid #dfe3e8; border-radius: 6px; font: inherit; }
  button {
    padding: 6px 10px; border: 1px solid #2563eb; border-radius: 6px;
    background: #2563eb; color: #fff; font: inherit; cursor: pointer;
  }
  button:hover { background: #1d4ed8; }
  button:disabled { background: #cbd2d9; border-color: #cbd2d9; cursor: default; }
  #from-map {
    min-height: 3em; padding: 8px 10px; border-radius: 6px;
    background: #f0fdf4; border: 1px solid #bbf7d0; color: #14532d;
  }
  #log { margin: 0; padding: 0; list-style: none; font: 12px/1.4 ui-monospace, Consolas, monospace; }
  #log li { padding: 4px 0; border-bottom: 1px solid #eef0f3; word-break: break-word; }
  #log .direction { display: inline-block; width: 88px; font-weight: 600; }
  #log .out .direction { color: #2563eb; }
  #log .in .direction { color: #15803d; }
  #log .notice { color: #6b7280; }
  iframe { flex: 1; min-width: 0; border: 0; background: #fff; }
</style>
</head>
<body>
<header>
  <h1>Your page</h1>
  <span id="status">Connecting to the map...</span>
</header>
<main>
  <aside>
    <section>
      <h2>Your buttons drive the map</h2>
      <div class="row">
        <select id="city" aria-label="City"><option>Belo Horizonte</option></select>
        <button id="show" disabled>Show on the map</button>
      </div>
      <div class="row">
        <button id="list" disabled>List the cities</button>
        <button id="add" disabled>Add Recife</button>
      </div>
    </section>
    <section>
      <h2>The map tells your page</h2>
      <div id="from-map">Click a city on the map, or press the button in the map's panel.</div>
    </section>
    <section>
      <h2>Messages</h2>
      <ol id="log"></ol>
    </section>
  </aside>
  <iframe id="mappia" title="Mappia map"></iframe>
</main>

<!--
  The map server. In your page these are two fixed tags:
    <iframe id="mappia" src="https://maps.csr.ufmg.br/calculator/?lang=eng&options=scale"></iframe>
    <script src="https://maps.csr.ufmg.br/mappia_io.js"></script>
  Here they are built from the address, so ?mappia_origin=https://localhost runs this page
  against a local Mappia.
-->
<script>
  var MAPPIA = new URLSearchParams(location.search).get("mappia_origin") || "https://maps.csr.ufmg.br";
  document.getElementById("mappia").src = MAPPIA + "/calculator/?lang=eng&options=scale";
  var library = document.createElement("script");
  library.src = MAPPIA + "/mappia_io.js";
  library.onload = start;
  document.head.appendChild(library);

  function start() {
    // true: keep listening after the handshake - this page talks with the map all along
    var mappia = MappiaIO("mappia", true);
    var citySelect = document.getElementById("city");
    var showButton = document.getElementById("show");
    var listButton = document.getElementById("list");
    var addButton = document.getElementById("add");
    var fromMap = document.getElementById("from-map");
    var waiting = {};
    var lastId = 0;

    // Every message, both ways, in the log.
    function write(className, direction, message) {
      var item = document.createElement("li");
      item.className = className;
      var label = document.createElement("span");
      label.className = "direction";
      label.textContent = direction;
      item.appendChild(label);
      item.appendChild(document.createTextNode(typeof message === "string" ? message : JSON.stringify(message)));
      document.getElementById("log").prepend(item);
    }

    // page -> map
    function send(message) {
      write("out", "page → map", message);
      mappia.send(message);
    }

    // page -> map, and wait for the answer: the query echoes the requestId back.
    function ask(operation, message) {
      var requestId = "request-" + (++lastId);
      return new Promise(function (resolve) {
        waiting[requestId] = resolve;
        send({ operation: operation, message: message, requestId: requestId });
      });
    }

    function refreshCities() {
      return ask("list_cities").then(function (answer) {
        var chosen = citySelect.value;
        citySelect.innerHTML = "";
        answer.message.forEach(function (city) {
          citySelect.add(new Option(city.name, city.name, false, city.name === chosen));
        });
        fromMap.textContent = answer.message.length + " cities on the map.";
      });
    }

    // map -> page: what the query posts with ExtjsUtils.QUERY.postMessage
    mappia.addOnMessageCallback(function (msg) {
      if (typeof msg === "string") { // the platform's own notices: "mappia__..."
        write("notice", "map → page", msg);
        if (msg === "mappia__queryApplied") {
          document.getElementById("status").textContent = "Connected: the map is ready";
          document.getElementById("status").className = "ready";
          [showButton, listButton, addButton].forEach(function (button) { button.disabled = false; });
          refreshCities();
        }
        return;
      }
      write("in", "map → page", msg);
      if (msg.requestId && waiting[msg.requestId]) { // the answer to an ask()
        waiting[msg.requestId](msg);
        delete waiting[msg.requestId];
      } else if (msg.operation === "city_clicked") {
        citySelect.value = msg.message.name;
        fromMap.textContent = "You clicked " + msg.message.name + " on the map: " +
          msg.message.population.toLocaleString("en") + " inhabitants.";
      } else if (msg.operation === "cities_in_view") {
        fromMap.textContent = msg.message.cities.length + " cities in view at zoom " + msg.message.zoom +
          ": " + msg.message.cities.join(", ") + ".";
      } else if (msg.operation === "city_shown") {
        fromMap.textContent = msg.message.found ? "The map is showing " + msg.message.name + "." : msg.message.name + " is not on the map.";
      } else if (msg.operation === "city_added") {
        fromMap.textContent = msg.message.name + " added: " + msg.message.count + " cities on the map.";
        refreshCities();
      }
    });

    // Your page's buttons
    showButton.addEventListener("click", function () {
      send({ operation: "show_city", message: { name: citySelect.value } });
    });
    listButton.addEventListener("click", refreshCities);
    addButton.addEventListener("click", function () {
      addButton.disabled = true; // once: a second Recife would be a second point
      send({ operation: "add_city", message: { name: "Recife", lon: -34.88, lat: -8.05, population: 1488920 } });
    });

    // The query lives next to this page; it is applied as soon as the map listens.
    mappia.addReadyCallback(function () {
      mappia.applyQueryFromUrl("cities-query.js");
    });
  }
</script>
</body>
</html>
Build it step by step
1. Embed a map and apply a query
applyQuery sends query text - the same text you would type in the editor - into the map. Called before the map has finished loading, it waits: MappiaIO queues it until the map answers the handshake.
<iframe id="mappia" src="https://maps.csr.ufmg.br/calculator/?lang=eng&options=scale"
        width="100%" height="600"></iframe>
<script src="https://maps.csr.ufmg.br/mappia_io.js"></script>
<script>
  // true: keep listening after the handshake (needed to receive messages later)
  var mappia = MappiaIO("mappia", true);
  mappia.applyQuery('[{ name: "CSR:estados", title: "States", visibility: true }]');
</script>
The query does not have to be saved on the server: it can be built by your page, kept in your own repository, or fetched - mappia.applyQueryFromUrl("/queries/states.js") fetches the text and applies it.
2. One map, many queries
The same connection can apply one query after another, and every apply replaces what the map shows. The map confirms each one with the message mappia__queryApplied, which is how the page knows the new layers are in place. Every “Run it live” button of this documentation works this way.
<button data-query="states">States</button>
<button data-query="elevation">Elevation</button>
<span id="status"></span>
<script>
  var queries = {
    states: '[{ name: "CSR:estados", title: "States", visibility: true }]',
    elevation: '[{ name: "CSR:altimetria", title: "Elevation", opacity: 0.8, visibility: true }]'
  };
  var mappia = MappiaIO("mappia", true);
  mappia.addOnMessageCallback(function (msg) {
    if (msg === "mappia__queryApplied") {
      document.getElementById("status").textContent = "Map updated";
    }
  });
  document.querySelectorAll("button[data-query]").forEach(function (button) {
    button.addEventListener("click", function () {
      document.getElementById("status").textContent = "Loading...";
      mappia.applyQuery(queries[button.getAttribute("data-query")]);
    });
  });
</script>
3. Your page’s buttons drive the map
A button, a list, a form field of your page sends an object with send. Its shape is yours to choose; by convention it names an operation and carries a message:
<select id="city"><option>Belo Horizonte</option><option>Manaus</option></select>
<button id="show">Show on the map</button>
<script>
  document.getElementById("show").addEventListener("click", function () {
    mappia.send({ operation: "show_city", message: { name: document.getElementById("city").value } });
  });
</script>
Inside the map, the query registers the function that receives them with ExtjsUtils.QUERY.setMappiaIoCallback. The function has to be reachable by name, so it is declared as a query global (the complete query is in the playground above - pick MappiaIO):
ExtjsUtils.QUERY.setQueryGlobalProperties({
  citiesLayer: null, // set by the layer's onAdded
  onPageMessage: function (msg) {
    var layer = window.citiesLayer;
    if (!msg || !msg.operation || !layer) return;
    if (msg.operation === "show_city") {
      var city = layer.features.filter(function (f) { return f.attributes.name === msg.message.name; })[0];
      if (city) layer.map.setCenter(city.geometry.getBounds().getCenterLonLat(), 7);
      ExtjsUtils.QUERY.postMessage({ operation: "city_shown", message: { name: msg.message.name, found: !!city } });
    }
  }
}) && ExtjsUtils.QUERY.setMappiaIoCallback(window.onPageMessage) && [
  { title: "Cities", name: "cities", source: "file", type: "json", fromProj: "EPSG:4326", json: { /* ... */ },
    onAdded: function (event) { window.citiesLayer = (event && event.layer) || this; } }
]
The page can also drive the map’s own widgets: a message that moves a slider recalculates the layer exactly as a drag would, so a field of your page can set a threshold on the map.
// map side, in onPageMessage
if (msg.operation === "set_threshold") {
  Ext.getCmp("threshold").setValue(0, msg.message.value, false, true); // the slider of the layer panel
}
4. The map’s buttons and clicks report to your page
ExtjsUtils.QUERY.postMessage(object) goes the other way. Anything in the query can call it: a click on a feature, a hover, a drawing finished, a button of the layer panel.
// map side: a button in the layer panel, and a click on a city
descriptionHtml: "{{button|id=send_view|text=Send the cities in view to the page|handler=sendViewToPage}}",
onClick: function (feature) {
  ExtjsUtils.QUERY.postMessage({ operation: "city_clicked", message: feature.attributes });
},
// ...and sendViewToPage, a query global:
sendViewToPage: function () {
  var view = window.citiesLayer.map.getExtent();
  var inView = window.citiesLayer.features.filter(function (f) {
    return view.containsLonLat(f.geometry.getBounds().getCenterLonLat());
  });
  ExtjsUtils.QUERY.postMessage({ operation: "cities_in_view",
    message: { cities: inView.map(function (f) { return f.attributes.name; }) } });
}
// page side: one listener for everything the map says
mappia.addOnMessageCallback(function (msg) {
  if (msg && msg.operation === "city_clicked") {
    document.getElementById("details").textContent =
      msg.message.name + ": " + msg.message.population + " inhabitants";
  } else if (msg && msg.operation === "cities_in_view") {
    document.getElementById("details").textContent = msg.message.cities.join(", ");
  }
});
5. Ask and wait for the answer
Messages are one-way. For a question with an answer, send an id and have the query echo it back, then match the two in the page:
var waiting = {}, lastId = 0;
mappia.addOnMessageCallback(function (msg) {
  if (msg && msg.requestId && waiting[msg.requestId]) {
    waiting[msg.requestId](msg);
    delete waiting[msg.requestId];
  }
});
function ask(operation, message) {
  var requestId = "request-" + (++lastId);
  return new Promise(function (resolve) {
    waiting[requestId] = resolve;
    mappia.send({ operation: operation, message: message, requestId: requestId });
  });
}

ask("list_cities").then(function (answer) {
  console.log(answer.message.length + " cities on the map", answer.message);
});
// map side: answer with the same requestId
ExtjsUtils.QUERY.postMessage({ operation: "cities", requestId: msg.requestId, message: names });
6. Start in the right order
A page that sends its starting state - the filters of the URL, the record being edited - needs the map listening and the query applied first. addReadyCallback runs once the map has answered the handshake; apply the query there, then send the state:
var mappia = MappiaIO("mappia", true);
mappia.addOnMessageCallback(onMapMessage);
mappia.addReadyCallback(function () {
  mappia.applyQueryFromUrl("/js/my-map-query.js").then(function () {
    mappia.send({ operation: "setFilters", message: currentFilters });
    if (sharedView) mappia.send({ operation: "flyTo", message: sharedView }); // a shared link reopens the same view
  });
});
Messages sent right after applyQuery reach the new query: it registers its listener while it is applied, and the platform holds the messages until then.
7. Let the map report on its own
The map does not have to wait to be asked. A long job reports its progress, a pan reports what is now in view, a request to your server reports that it started and ended - the page keeps its own list, counters and spinners in step:
// map side: progress of a download, tagged with the request it belongs to
ExtjsUtils.OFFLINE.downloadArea({
  name: msg.message.name, extent: msg.message.extent,
  onProgress: function (progress) {
    ExtjsUtils.QUERY.postMessage({ operation: "download.progress", requestId: msg.requestId, message: progress });
  }
}).then(function (area) {
  ExtjsUtils.QUERY.postMessage({ operation: "download.result", requestId: msg.requestId, message: area });
});
// page side: progress updates the bar; the result settles the request
mappia.addOnMessageCallback(function (msg) {
  if (msg && msg.operation === "download.progress") {
    progressBar.value = msg.message.done / msg.message.total;
  }
});
8. Send a file
A file the user picked in your page can go to the map as it is - for the query to read, import or upload:
fileInput.addEventListener("change", function () {
  mappia.send({ operation: "importFromFile", message: { file: fileInput.files[0], name: "My area" } });
});
A message that carries a File or Blob is not turned into JSON: the browser copies the file along with it. This needs the next release of mappia_io.js; the version on maps.csr.ufmg.br today still turns a file into {}.
In production
MappiaIO is how Mappia maps are put to work inside other products. Three of them:
LarBH - real-estate search in Belo Horizonte
The whole search is a page around a Mappia map. Its query starts with no layers at all: it draws the listings from code, coloured by price, and the page and the map keep each other in step - the map understands 17 operations from the page and sends 11 back. The count "111.197 imóveis na área", the listing column and the neighbourhood list are built from what the map reports after every pan and zoom. A listing's detail has a second, small map with the places nearby: one page, two maps, a connection each.
// how it starts (simplified)
var mappia = new MappiaIO("mappia-frame", true);
mappia.addOnMessageCallback(onTenantMessage);
mappia.addReadyCallback(function () {
  // the query lives in the site's own code
  fetch("/js/imoveis-tenant-query.js")
    .then(function (r) { return r.text(); })
    .then(function (text) {
      mappia.applyQuery(text);
      mappia.send({ operation: "setEscala", message: { escala: priceScale } });
      mappia.send({ operation: "setFilters", message: filters });
    });
});
Offline map areas - a whole tool outside the platform
Choosing which layers and which area to download for use without a network, estimating the size, downloading with progress, switching areas on and off, importing a zip: a complete tool, built as an ordinary page around the map (MappiaExplorer's examples/offline-areas-demo). The page holds every control; the map does the work with ExtjsUtils.OFFLINE and answers - 23 operations, each a question with a requestId.
- The layer list is the map's answer to
offlineAreas.listAvailableLayers; the area isofflineAreas.getImovelView- the property's own boundary. offlineAreas.downloadanswers many times:.progresswhile it runs, then.resultor.error, all with the request's id.- The tile feed under the status is pushed by the map without being asked (
offlineAreas.mapCacheDebug): how each tile was served, as it happens. - Importing sends the zip the user picked, as a file (
offlineAreas.importFromFile).
This documentation
Every Run it live button of these pages and the playground above load the calculator in an iframe and send the example with applyQuery, waiting for mappia__queryApplied before saying the map is ready (assets/js/mappia-live.js of this site).
Things to know
- Pass
trueas the second argument whenever the page keeps talking to the map. WithfalseMappiaIO stops listening after the handshake, and nothing from the map arrives. - One listener, many operations. Register one
addOnMessageCallbackand branch onoperation, as the complete page does; each registered function receives every message. - The page also receives the platform’s own notices, as plain strings starting with
mappia__:mappia__queryAppliedafter everyapplyQuery,mappia__confirmQueryListeningwhen a query registers its callback. Use the first; skip the rest. Never send them yourself. applyQueryreturns no promise. Wait formappia__queryAppliedto know the layers are in place (applyQueryFromUrlreturns one, but it settles when the text was sent).- A query’s message callback outlives it. When a later query registers no callback of its own, messages still reach the previous one - so a handler should check that what it works on still exists, as
onPageMessagedoes withcitiesLayerabove. noopenerandnoreferrerbreak the connection, on the iframe or inwindow.open. MappiaIO works with a separate window too:MappiaIO(window.open(url), true).- Drop the connection with the map: when your page removes the iframe (a closed panel, a route change), call
remove()so the old connection stops receiving messages.