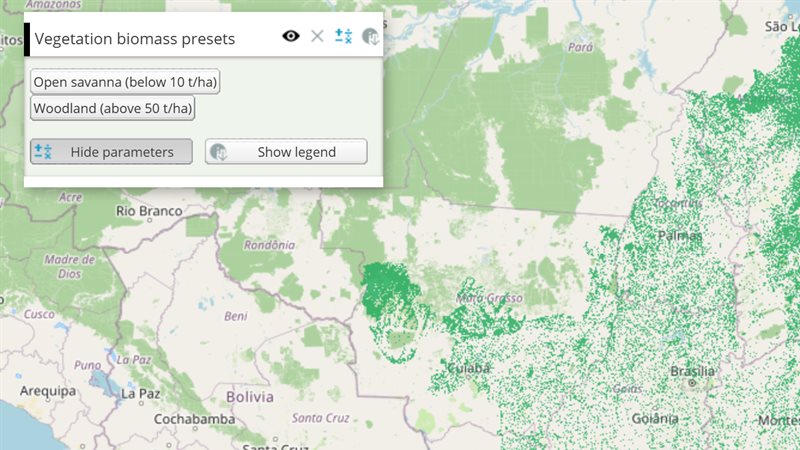
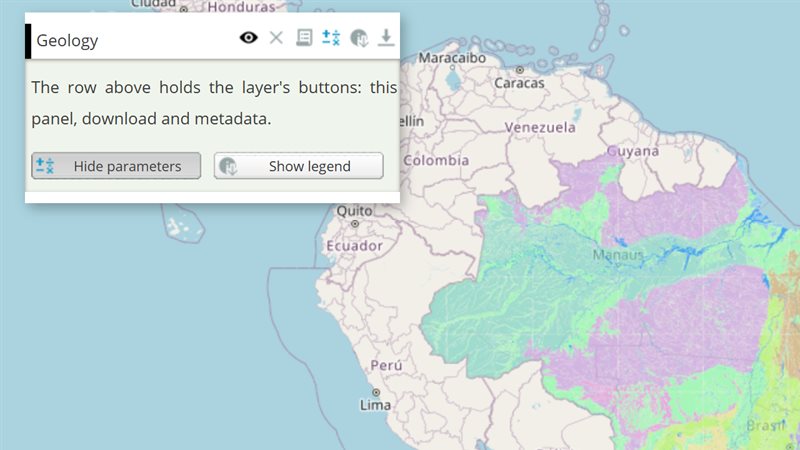
JSON file source Layer

Quick start

The example below, running in the Mappia calculator - click it to run it live. Full-size picture

  1. Run it

    Click the picture: the map opens right here and runs the example. Nothing is saved, and nothing to install.

  2. Try it
    • Find the two orange areas and point C drawn over Brazil from the inline GeoJSON.
    • Change a coordinate inside json and run it again: that shape moves on the map.
    • Delete the fromProj line and run it again: the shapes are no longer over Brazil.
  3. Make it yours

    Copy the query, change it - the key parameters are below - and run it again in the playground, or paste it into the Mappia editor to save it as your map.

  4. More ways to use it

Key parameters

ParameterExampleWhat it does
sourcefileMakes the layer hold vector features drawn in the browser, instead of map images from a server.
typejsonHow features are loaded: json inline, geojsonurl or csv from url, empty to fill later, load with your own loader.
json{ type: "FeatureCollection", features: [...] }The inline data for type: "json": a GeoJSON object, or an array of plain objects with lon and lat.
urlhttps://example.com/data/areas.geojsonThe file fetched by the geojsonurl, csv and jsonurl types; relative paths resolve on the Mappia server.
nameinline_areasA unique identifier for the layer; use it to find the layer again from your code.

Every parameter, with its type and default, is in the reference at the end of this page.

Complete example

The query 24 lines · runs as is
// File layer: features from inline GeoJSON (type json). Declare fromProj - GeoJSON without a
// crs is otherwise read in the platform's default projection and lands in the wrong place.
[
  {
    title: "Inline GeoJSON",
    name: "inline_areas",
    source: "file",
    type: "json",
    fromProj: "EPSG:4326",
    visibility: true,
    json: {
      type: "FeatureCollection",
      features: [
        { type: "Feature", properties: { name: "Area A" },
          geometry: { type: "Polygon", coordinates: [[[-48, -16], [-44, -16], [-44, -20], [-48, -20], [-48, -16]]] } },
        { type: "Feature", properties: { name: "Area B" },
          geometry: { type: "Polygon", coordinates: [[[-56, -6], [-50, -2], [-50, -10], [-56, -6]]] } },
        { type: "Feature", properties: { name: "Point C" },
          geometry: { type: "Point", coordinates: [-40.5, -12] } },
      ],
    },
    defaultStyle: { fillColor: "#e67e22", fillOpacity: 0.5, strokeColor: "#a84300", strokeWidth: 2, pointRadius: 8 },
  },
];

More examples

Other ways to use JSON file source Layer, each a complete query that runs as is - like the one above.

Points from a CSV file

Each row becomes a point at its coord_x / coord_y, with the other columns as its attributes, and close points are grouped into clusters.

Click the picture to run it live. Full-size picture

The query 29 lines · runs as is
// Points from a CSV file: each row becomes a point at its coord_x / coord_y, with the other columns as its attributes, and close points are grouped into clusters.
// type csv fetches the file at url; coordinates names the two columns; clusterDistance (pixels)
// groups points closer than that into one symbol, whose count attribute the label shows.
// Zoom in to split the clusters.
[
  {
    title: "Listings from a CSV file",
    name: "csv_listings",
    source: "file",
    type: "csv",
    url: "/theme/app/data/teste_csv_points.csv", // coord_x,coord_y,size,address,price,type,...
    coordinates: { x: "coord_x", y: "coord_y" },
    fromProj: "EPSG:4326",
    clusterDistance: 45,
    visibility: true,
    defaultStyle: {
      graphicName: "circle",
      pointRadius: 13,
      fillColor: "#16a085",
      fillOpacity: 0.9,
      strokeColor: "#ffffff",
      strokeWidth: 2,
      label: "${count}", // how many rows the symbol stands for
      fontColor: "#ffffff",
      fontSize: "11px",
      fontWeight: "bold",
    },
  },
];

A GeoJSON file, labelled

Type geojsonurl loads a GeoJSON file by URL, and ${…} in the style writes an attribute of each feature on the map - here the regions of Belo Horizonte.

Click the picture to run it live. Full-size picture

The query 25 lines · runs as is
// A GeoJSON file, labelled: type geojsonurl loads a GeoJSON file by URL, and ${...} in the style writes an attribute of each feature on the map - here the regions of Belo Horizonte.
// The file has no crs member, so fromProj says its coordinates are longitude / latitude.
[
  {
    title: "Regions of Belo Horizonte",
    name: "bh_regions",
    source: "file",
    type: "geojsonurl",
    url: "/theme/app/data/regioes.geojson", // properties: NOME_REGIO, SIGLA_REGI, ID_REGIONA
    fromProj: "EPSG:4326",
    visibility: true,
    defaultStyle: {
      fillColor: "#8e44ad",
      fillOpacity: 0.2,
      strokeColor: "#5b2c6f",
      strokeWidth: 2,
      label: "${NOME_REGIO}",
      fontSize: "13px",
      fontWeight: "bold",
      fontColor: "#2c3e50",
      labelOutlineColor: "#ffffff",
      labelOutlineWidth: 3,
    },
  },
];

Customize it

Always say which projection the data uses

GeoJSON without a crs member is read in the platform’s default projection, Web Mercator metres (EPSG:900913). Longitude and latitude read that way land in the wrong place, with no error. Add fromProj: "EPSG:4326" to the layer for longitude/latitude data, as the example does, or put a crs in the GeoJSON. To set it once for every vector layer of the query, chain ExtjsUtils.CONFIGURATION.setOptions({ defaultFromProj: "EPSG:4326" }) before the layer list.

GeoJSON coordinates go longitude first: [-44, -19], not [-19, -44].

Load features from a file

typeWhere the features come from
json (the default)The inline json: GeoJSON, or an array of plain objects
geojsonurlA GeoJSON file at url
csvA CSV file at url, one point per line
jsonurlA JSON array of plain objects at url
emptyNothing yet; you add features later from code
loadYour own loadData(inputs, config) function

For CSV lines and plain objects, each entry becomes a point read from its lon and lat fields, and the other fields become its attributes. If your fields have other names, map them with coordinates: { x: "longitude", y: "latitude" }.

Style the features

defaultStyle takes OpenLayers style properties: fillColor, fillOpacity, strokeColor, strokeWidth, pointRadius. selectStyle styles a clicked feature and needs an onClick callback; hoverStyle styles a hovered one and needs an onHover callback.

React to a click

popupTemplate and popupCallback are accepted but never read: no popup opens. Use onClick, which receives the clicked feature with its GeoJSON properties in attributes:

{
  name: "farms",
  source: "file",
  type: "geojsonurl",
  url: "https://example.com/data/farms.geojson",
  fromProj: "EPSG:4326",
  onClick: function (feature) {
    ExtjsUtils.ALERTIFY.log("You clicked " + feature.attributes.name);
  },
  onAdded: function () {
    ExtjsUtils.JS.getMap().zoomToExtent(this.getDataExtent());   // zoom to the data
  },
}

onAdded runs once the layer is on the map and its features are loaded, which makes it the place to zoom to them.

Many points

Set clusterDistance: 40 to group points closer than 40 pixels into one symbol. Each cluster carries the number of points it holds in attributes.count.

Change the data later

Start with type: "empty" and add features when you have them, for example from a message sent by the page that embeds the map (MappiaIO):

ExtjsUtils.LAYER.getLayerByName("farms").loadGeojson(geojson, "EPSG:4326");

To draw a marker or a highlight that should not appear in the layer panel, use an overlay layer instead.

Real maps that use it

Simple File Source Layer Example

Simple File Source Layer Example

Simple File Source Layer Example

SimAmazoniaINFRA - Deforestation and CO2 scenarios

SimAmazoniaINFRA - Deforestation and CO2 scenarios

Reference: the parameters used here

Generated from the platform source. Every entry, searchable, is in the API reference; the raw data is api.json. Open an entry for its description, parameters and example; # links to it.

Layer properties

LayersProperties1 entry
Keys of a layer object: which map it shows (name, source, styles), how it looks (title, opacity, visibility) and how its row and panel behave.

source

String= 'local'property# Defines the source from where the maps declared at the name will be loaded from.

Defines the source from where the maps declared at the name will be loaded from. The Source can be one of the following:

  • 'local': The maps in the name will be loaded from the CSR servers

  • 'calculate': The maps in the name gonna be used to calculate a new map in the expression() function and the result will be displayed as the Layer

  • 'file': The map will be loaded from a file or other custom source. For this, you need to define the file type in the 'type' property and the file where the map should be loaded. For example, for a JSON file, you also need to define the 'json' property.

  • 'xyz': The map will be loaded from an url by the XYZ protocol. The url property is required for this type of source. You can find more informations about the XYZ protocol at: https://developers.planet.com/docs/basemaps/tile-services/xyz/

// Example of how to load a map with the local source
[
  {
     title: 'Map rendered by a local source',
     color: '#666699',
     elements: [
        {
           title: 'Map with local source',
           name: 'CSR:paises',
           source: 'local',
           visibility: true,
        },
     ],
  },
]
// Example of how to load a map with the calculated source
[
  {
     title: 'Map rendered based on calculation',
     color: '#666699',
     elements: [
        {
           title: 'Filtering a part of the map',
           name: 'CSR:geologia',
           source: 'calculate',
           visibility: true,
           updateAutomatically: true,
           expression: function(layersVals, inputs) {
              // layerVals have the value of the legend applied in every pixel of the map
              let mapValue = layersVals[0];

              // Remove every type of relief that is not 'Mantiqueira'
              if(mapValue != 'Mantiqueira') { // If the pixel is not 'Mantiqueira'
                 return undefined; // Don't show the pixel
              }

              // If the pixel is 'Mantiqueira', return the value of the pixel
              return mapValue;
           },
        },
     ],
  },
]
// Example of how to load a map with the file source
[
  {
     title: 'Map rendered based on file source',
     color: '#FFA500',
     elements: [
        {
           title: 'Map with file source',
           name: 'example:map_file_source',
           source: 'file',
           visibility: true,
           // The map is rendered based on the GeoJSON below
           // The GeoJSON needs to be in EPSG:3857
           json: JSON.stringify(
              {
                 "type": "Polygon",
                 "crs": {
                    "type": "name",
                    "properties": {
                       "name": "EPSG:3857"
                    }
                 },
                 "coordinates": [
                    [
                       [
                          -625570.6,
                          6465993.0,
                       ],
                       [
                          -305006.9,
                          6696510.8,
                       ],
                       [
                          -546330.2,
                          6768547.6,
                       ],
                       [
                          -445478.6,
                          7053093.0,
                       ],
                       [
                          -279794.0,
                          7056694.8,
                       ],
                       [
                          -359034.5,
                          7337638.4,
                       ],
                       [
                          -211359.0,
                          7485313.8,
                       ],
                       [
                          62380.8,
                          6955843.3,
                       ],
                       [
                          220861.7,
                          6909019.4,
                       ],
                       [
                          91195.5,
                          6700112.6,
                       ],
                       [
                          213658.1,
                          6682103.4,
                       ],
                       [
                          -625570.6,
                          6465993.0,
                       ],
                    ],
                 ],
              }
           ),
        },
     ],
  },
]
// Example of how to load a map with the XYZ source
// The XYZ source is used to load a map from a URL that contains the {z}, {x} and {y} placeholders
// The {z} is the zoom level, {x} is the longitude and {y} is the latitude
[
  {
     title: 'Map rendered by a XYZ source',
     color: '#666699',
     elements: [
        {
           title: 'Base map loaded by XYZ source',
           // The name of the map that will be added. This name must be unique
           name: 'planet:planet',
           source: 'xyz',
           // The url of the map that will be loaded. The ${z}, ${x} and ${y} placeholders will be replaced by the map library
           url: 'https://tiles.planet.com/basemaps/v1/planet-tiles/planet_medres_visual_2021-09_mosaic/gmap/${z}/${x}/${y}.png?api_key=PLAK78456687760442eaa3d3da16aaac5f2d',
           visibility: true,
        },
     ],
  },
]

File layers: data

FileLayer2 entries
source: "file": where the features come from - json written in the query (the default type), type with a url, or type "load" with your own loadData.

json

Array.<Object>|Object# Inline data of a source: 'file' layer with type: 'json'.

Inline data of a source: 'file' layer with type: 'json'. Either a GeoJSON object (FeatureCollection, Feature or a geometry; its projection is taken from fromProj, its crs or guessed from the coordinates) or an array of plain objects, each converted to a feature with convertJsonEntryToFeature (see coordinates/getVector). A JSON string is also accepted.

{
   name: 'CSR:inline_points',
   source: 'file',
   type: 'json',
   fromProj: 'EPSG:4326',
   json: [
      {name: 'Belo Horizonte', lon: -43.94, lat: -19.92},
      {name: 'Brasilia', lon: -47.88, lat: -15.79},
   ],
}

type

String= "json"# Defines how a source: 'file' layer gets its features (case insensitive).

Defines how a source: 'file' layer gets its features (case insensitive). One of:

'load': you load the data yourself in the loadData callback (function(inputs, config), called with the layer as this).
   The callback must trigger this.events.triggerEvent('startLoadingLayer') before and this.events.triggerEvent('endLoadingLayer') after each load (the calls are cumulative). 'csv': fetches the CSV file at url; each line becomes a feature through convertJsonEntryToFeature (see coordinates/getVector). 'json': uses the inline json data: a GeoJSON object (FeatureCollection, Feature or geometry) or an array of plain objects converted with convertJsonEntryToFeature. 'jsonurl': fetches an array of plain objects from url and converts each one with convertJsonEntryToFeature. 'geojsonurl': fetches a GeoJSON file from url (projection detected from its crs, fromProj or the coordinates). 'empty': creates no feature; the usual choice for layers that are drawn into or filled later with loadGeojson/addFeatures.

When omitted the type is 'json'; an unknown value falls back to 'jsonurl'.

[
  {
     title: 'Vector layers',
     color: '#FFA500',
     elements: [
        {
           title: 'Municipalities from a GeoJSON file',
           name: 'CSR:municipalities_file',
           source: 'file',
           type: 'geojsonurl',
           url: 'https://maps.csr.ufmg.br/theme/app/data/example.geojson',
           visibility: true,
        },
        {
           title: 'Empty layer to draw on',
           name: 'CSR:drawing_file',
           source: 'file',
           type: 'empty',
           visibility: true,
        },
     ],
  },
]

File layers: style, events, drawing

VectorLayer4 entries
Keys and methods of a file layer: styles, clustering, click and hover callbacks (onClick, onHover), drawing (drawable), and the methods your functions call on this.
View complete VectorLayer documentation API here.

defaultStyle

Object# Defines the default style that will be applied to the geometry.

Defines the default style that will be applied to the geometry. PS: Accepts 'context' and 'rules'.
    Property 'context': allows definition of functions.
    Property 'rules': allows definition of filters (only the geometries that fit into this rule will be displayed).

Look at some examples at: http://dev.openlayers.org/examples/

defaultStyle: {color: '${getColor}', context: {getColor: function(attr){return 'green';} }

fromProj

String# Defines the projection of the JSON (accepts only EPSG:4326 and EPSG:900913).

Defines the projection of the JSON (accepts only EPSG:4326 and EPSG:900913).

EPSG:900913

onAdded

function()# Called when the layer is on the map with its features loaded.

Called when the layer is on the map with its features loaded. If the layer is still fetching (jsonurl / geojsonurl / csv / async load), waits for that load to finish first so this.features / this.getDataExtent() are available (a failed load still calls it). this is the layer.

AddedEvent {
    element: {DOM} 'DOM element of the layer',
    layer: {OpenLayers.Layer.Vector} 'Javascript Object of the layer',
    map: {Map} 'MapPanel where the layer was added.',
    type: {String} 'Type of the event ( added )' }

onAdded: function(evt) {
    var bounds = this.getDataExtent();
    if (bounds) ExtjsUtils.JS.getMap().zoomToExtent(bounds);
}

onClick

function# Defines the callback function to the click event on Layer.

Defines the callback function to the click event on Layer.

event Object
The click event Object.
source VectorFileSource
Auxiliary functions to deal with Vector Layer.
inputs Array.<Object>
Array with all layer input values.
{
     ...,
     onClick: function (feature) {
    console.log(feature.attributes);
         console.log("Triggered click event!");
     },
     ...
}
[{
  name:"CSR:FileGeojson",
  source: "file",
  type: "geojsonurl",
  url: "/theme/app/data/fip_interativo/amazonia/amazonia_municipios.geojson",
  onClick: function(feature, layerSource, inputs, toggleStatus) {
    console.log(arguments);
  }
}]