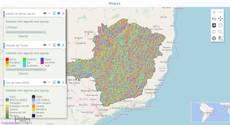
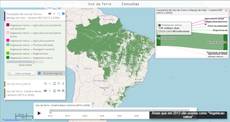
Map publishing customization
Example of map publishing using layout created in QGIS.
Reference: the parameters used here
Generated from the platform source. Every entry, searchable, is in the API reference; the raw data is api.json. Open an entry for its description, parameters and example; # links to it.
QUERY · setup calls and the running query
QUERY1 entrysetQueryGlobalProperties
function(globalProperties) : Booleanhelper# Defines globals for the query: every key of globalProperties becomes a window property (a value, an object or a function) that layer definitions, markup widgets (handler=, onMark=...) and …
setQueryGlobalPropertiesWritten as ExtjsUtils.QUERY.setQueryGlobalProperties
Defines globals for the query: every key of globalProperties becomes a window property (a value, an object or a function) that layer definitions, markup widgets (handler=, onMark=...) and other query code can reference by name. The names are recorded and the globals are deleted when another query loads. A key that already exists on window and was not created by the query is refused with "Global variable can't be redefined" in the console (the platform's own globals are protected; redefining one of the query's own keys is fine). runNow is the only key the platform itself invokes: right after the globals are registered QUERY.runNow is called once (see that entry). Chain it with && before the layer array so the globals exist when the layers are evaluated; QUERY_DESCRIPTION in the examples stands for that array.
- globalProperties Object
- Object whose keys become globals; each value may be a value, an object or a function.
Returns Always true, so the call can be chained with && QUERY_DESCRIPTION.
ExtjsUtils.QUERY.setQueryGlobalProperties({
  globalCount: 0,
  onLayerButton: function(btn) { console.log("clicked", btn); },
  runNow: function() { ExtjsUtils.ZOOM.limitZoomLevel(17); }
}) && [
  { name: "CSR:estados", visibility: true, descriptionHtml: "{{button|id=b1|text=Go|handler=onLayerButton}}" }
]
timeline · scenarios over time (input)
Timeline31 entriesWritten in a layer's descriptionHtml as {{timeline|parameter=value|...}}
fieldLabel
String# Defines a label for the Timeline.
fieldLabelDefines a label for the Timeline. It will be shown at the left of the button to hide the tiemline, by default.
|fieldLabel=This is the field label|getCurrentLayerStyle
function() : String# Returns the WMS style currently applied to the layer (layer.params.STYLES), or an empty string for the default style.
getCurrentLayerStyleReturns the WMS style currently applied to the layer (layer.params.STYLES), or an empty string for the default style.
Returns The active style name.
var style = Ext.getCmp('years_tl').getTimeline().getCurrentLayerStyle();getDesiredVisibility
function() : Boolean# Returns the visibility the timeline has, or will have when its layer becomes visible: true may be returned while the panel is actually hidden because the layer is hidden.
getDesiredVisibilityReturns the visibility the timeline has, or will have when its layer becomes visible: true may be returned while the panel is actually hidden because the layer is hidden.
Returns true when the timeline is (or will be) shown together with the layer.
var shown = Ext.getCmp('years_tl').getTimeline().getDesiredVisibility();getMainThumb
function() : Ext.slider.Thumb# Returns the main (middle) thumb of the slider — the one that selects the current step; its value is the 0-based step index.
getMainThumbReturns the main (middle) thumb of the slider — the one that selects the current step; its value is the 0-based step index. The outer thumbs (thumbs[0], thumbs[2]) bound the animation range.
Returns The main thumb; read the step index from .value.
var stepIndex = Ext.getCmp('years_tl').getTimeline().getMainThumb().value;getMaxThumbValue
function() : Number# Returns the position of the right (max) thumb: the last step index the animation reaches.
getMaxThumbValueReturns the position of the right (max) thumb: the last step index the animation reaches.
Returns 0-based step index of the max thumb.
var last = Ext.getCmp('years_tl').getTimeline().getMaxThumbValue();getMinThumbValue
function() : Number# Returns the position of the left (min) thumb: the step index the animation restarts from.
getMinThumbValueReturns the position of the left (min) thumb: the step index the animation restarts from.
Returns 0-based step index of the min thumb.
var first = Ext.getCmp('years_tl').getTimeline().getMinThumbValue();getStyleFromValue
function(value) : String|Object|undefined# Returns the style of a step key or, when the key has no style of its own, the style of the nearest previous key (numeric keys are compared as numbers, text keys by position in steps).
getStyleFromValueReturns the style of a step key or, when the key has no style of its own, the style of the nearest previous key (numeric keys are compared as numbers, text keys by position in steps).
- value String|Number
- A step key.
Returns The style (name or {style, name} object), or undefined when no previous step has one.
var style = Ext.getCmp('years_tl').getTimeline().getStyleFromValue('2014');getTimeline
function() : GeoExt.TimelinePanel# Returns the timeline panel driven by this button.
getTimelineReturns the timeline panel driven by this button. The markup id identifies the button, so this is the way to reach the panel methods (getValue, updateMainThumbValue, startAnimationStep, setSteps...).
Returns The timeline panel (null after the button was destroyed).
var timeline = Ext.getCmp('years_tl').getTimeline();
timeline.updateMainThumbValue(0); // first step
getValue
function() : String# Returns the key of the step currently selected by the main thumb (the same value the layer receives in inputs.id[ID]).
getValueReturns the key of the step currently selected by the main thumb (the same value the layer receives in inputs.id[ID]).
Returns The current step key (first element of the steps entry).
var year = Ext.getCmp('years_tl').getTimeline().getValue(); // '2010'getValueFromStyle
function(style) : Number# Returns the step key whose style is the given one (the last match when several steps share a style), or the first step key when the style is empty or unknown.
getValueFromStyleReturns the step key whose style is the given one (the last match when several steps share a style), or the first step key when the style is empty or unknown. The key is returned through parseInt, so it is meaningful for numeric keys only (text keys give NaN).
- style String
- A style name as used in
steps.
Returns The numeric step key.
var year = Ext.getCmp('years_tl').getTimeline().getValueFromStyle('style_2010'); // 2010hidden
Boolean= false# Set true to hide the "Show/Hide timeline" button rendered in the layer description (the standard Ext hidden config, so Ext.getCmp(id).show() reveals it).
hiddenSet true to hide the "Show/Hide timeline" button rendered in the layer description (the standard Ext hidden config, so Ext.getCmp(id).show() reveals it). The timeline panel itself is still created and its initial visibility follows renderHidden; use it when the timeline is driven by a paramsButtonConfig button or by code instead. Any other Ext.Button config is passed through.
|hidden=true|hideLabel
Boolean= false# Defines if the label of the timeline should be displayed.
hideLabelDefines if the label of the timeline should be displayed. Set true to hide the label, false to show it.
|hideLabel=true|id
String# Defines the id to identify the object.
idDefines the id to identify the object. It is the key used in inputs.id[ID] and the id of the show/hide button component: Ext.getCmp(id) returns the button and Ext.getCmp(id).getTimeline() the timeline panel (see the methods listed in this group).
|id=exemple_timeline|nextAnimationStep
function()# Advances the timeline one step (main thumb + 1), applying the style of the new step to the layer and firing change; does nothing when the main thumb is already at the max thumb.
nextAnimationStepAdvances the timeline one step (main thumb + 1), applying the style of the new step to the layer and firing change; does nothing when the main thumb is already at the max thumb. Useful for a custom "next" button.
Ext.getCmp('years_tl').getTimeline().nextAnimationStep();nextStepInterval
Number= 2100# Defines the duration of the interval between steps of the timeline in milliseconds.
nextStepIntervalDefines the duration of the interval between steps of the timeline in milliseconds.
|nextStepInterval=1000|onPlayToggle
function# Defines the callback function called when the play/stop button is toggled, BEFORE the animation starts or stops.
onPlayToggleDefines the callback function called when the play/stop button is toggled, BEFORE the animation starts or stops. It must return a truthy value: returning false/nothing cancels the start/stop (use it as a veto, e.g. while data is loading). pressed is true when the animation is about to start.
The value is resolved as a key of the layer functions object, then as a global function with that name, then as inline function text (function(...){...}; a plain statement body also works and returns true).
- pressed Boolean
- True if the button was pressed (animation about to start), False otherwise.
- layer Object
- The layer associated to this timeline.
- timeline Object
- The timeline panel.
- playBtn Object
- The play/stop button.
|onPlayToggle=onPlayToggle||onPlayToggle = function (pressed, layer, timeline, playBtn) {
console.log("The timeline is about to " + (pressed ? "start" : "stop"));
return true; // required, a falsy return cancels the toggle
}|playing
Boolean= false# true while the animation is running (between play and stop/end).
playingtrue while the animation is running (between play and stop/end). Read it on the panel (Ext.getCmp(id).getTimeline().playing) to know whether to call startAnimationStep() or stopAnimation().
if (!Ext.getCmp('years_tl').getTimeline().playing) Ext.getCmp('years_tl').getTimeline().startAnimationStep();preloadTiles
Boolean= false# Defines if the timeline should preload the tiles of the next steps to get smoother transitions.
preloadTilesDefines if the timeline should preload the tiles of the next steps to get smoother transitions. Set it true to preload, false otherwise.
|preloadTiles = true|renderHidden
Boolean= false# Defines the timeline initial visibility.
renderHiddenDefines the timeline initial visibility. Set it true to start with the timeline hidden, false otherwise.
|renderHidden = true|setCurrentLayerStyle
function(style)# Applies a style to the layer the way a step does: a style name, or a {style, name} object that also switches the WMS layer name (the object form of a steps entry).
setCurrentLayerStyleApplies a style to the layer the way a step does: a style name, or a {style, name} object that also switches the WMS layer name (the object form of a steps entry). For a composed layer the first inner layer is updated and the legend is rebuilt. The slider is not moved (use updateMainThumbValue).
- style String|Object
- Style name (
''for the default) or{style: 'name', name: 'CSR:layer'}.
Ext.getCmp('years_tl').getTimeline().setCurrentLayerStyle({style: 'estados_2', name: 'CSR:estados'});setDesiredVisibility
function(visible) : GeoExt.TimelinePanel# Shows or hides the timeline panel while keeping it consistent with the layer: when the layer is hidden the panel stays hidden and the requested state is remembered, to be applied as soon as the layer becomes visible.
setDesiredVisibilityShows or hides the timeline panel while keeping it consistent with the layer: when the layer is hidden the panel stays hidden and the requested state is remembered, to be applied as soon as the layer becomes visible. Prefer it over show()/hide(); the show/hide button follows the panel automatically.
- visible Boolean
trueto show the timeline (once the layer is visible),falseto hide it.
Returns The panel, for chaining.
Ext.getCmp('years_tl').getTimeline().setDesiredVisibility(true);setMaxThumbValue
function(value)# Moves the right (max) thumb, limiting the animation to the steps up to that index (no animation, no change event).
setMaxThumbValueMoves the right (max) thumb, limiting the animation to the steps up to that index (no animation, no change event).
- value Number
- 0-based step index for the max thumb.
Ext.getCmp('years_tl').getTimeline().setMaxThumbValue(5);setMinThumbValue
function(value)# Moves the left (min) thumb, making the animation start from that step index (no animation, no change event).
setMinThumbValueMoves the left (min) thumb, making the animation start from that step index (no animation, no change event).
- value Number
- 0-based step index for the min thumb.
Ext.getCmp('years_tl').getTimeline().setMinThumbValue(2);setSteps
function(steps)# Replaces the steps of the timeline and redraws it (labels, slider range and current step).
setStepsReplaces the steps of the timeline and redraws it (labels, slider range and current step). Unlike the markup steps parameter this takes the already-built object: keys are the step labels, values the style name or a {style, name} object. Use it to change the available periods at runtime (e.g. after a combobox selection).
- steps Object
- Map of step key to style:
{'1990': 'style_1990', '2000': {style: 's2000', name: 'CSR:layer'}}.
Ext.getCmp('years_tl').getTimeline().setSteps({2000: 'style_2000', 2010: 'style_2010'});startAnimationStep
function()# Starts (or resumes) the animation from the current step: each step is shown for nextStepInterval milliseconds after the layer finished loading it, up to the max thumb, where the animation stops by itself.
startAnimationStepStarts (or resumes) the animation from the current step: each step is shown for nextStepInterval milliseconds after the layer finished loading it, up to the max thumb, where the animation stops by itself. When the main thumb is already at the max thumb it restarts from the min thumb. Same as pressing the play button, except that onPlayToggle is not consulted.
Ext.getCmp('years_tl').getTimeline().startAnimationStep();steps
Array.<Array.<(String|Object)>># Defines the timeline change steps.
stepsDefines the timeline change steps.
|steps=[["step_0"], ["step_1"], ["step_2"]]||steps=[['Nome', {style:"step_0_style",name:"CSR:estados"}], ['Região', {style:"step_1_style",name:"CSR:estados"}], ['Geocódigo', {style:"step_2_style",name:"CSR:estados"}]]||steps=[['Nome', 'step_0'], ['Região', 'step_1'], ['Geocódigo', 'step_2']]||steps=[{1990: "layer_style0", 1991: "layer_style1", 1992: "layer_style2"}, 1993: "layer_style3"}]|stopAnimation
function()# Stops the running animation (cancels the pending step timer, releases the play button and hides the slider tip).
stopAnimationStops the running animation (cancels the pending step timer, releases the play button and hides the slider tip). The current step is kept. Safe to call when nothing is playing.
Ext.getCmp('years_tl').getTimeline().stopAnimation();toggleTimelineVisibility
function(forceState)# Shows or hides the timeline panel from code — what clicking the button does.
toggleTimelineVisibilityShows or hides the timeline panel from code — what clicking the button does. Without an argument the current (desired) visibility is inverted. The panel only appears while the layer is visible; the requested state is remembered otherwise (see setDesiredVisibility).
- forceState Boolean
trueto show the timeline,falseto hide it; omit to invert.
Ext.getCmp('years_tl').toggleTimelineVisibility(true);updateLayer
function(value)# Applies to the layer the style of a step key, without moving the slider.
updateLayerApplies to the layer the style of a step key, without moving the slider. When the key has no step of its own the style of the nearest previous numeric key is used (steps {2010: "s1", 2015: "s2"} and value 2014 keep/apply "s1"); nothing happens when that style is already active. Called by the slider on every change; call it yourself to preview a step, then updateMainThumbValue() to sync the thumb.
- value String|Number
- A step key (first element of a
stepsentry).
Ext.getCmp('years_tl').getTimeline().updateLayer('2010');updateMainThumbValue
function(value)# Moves the main thumb to a step index (0-based position in steps), applying that step's style to the layer and firing change — the programmatic way to select a step.
updateMainThumbValueMoves the main thumb to a step index (0-based position in steps), applying that step's style to the layer and firing change — the programmatic way to select a step. Without an argument it re-syncs the thumb with the layer's current style using getValueFromStyle (used when another tool changes the style). The min/max thumbs are pushed outwards when the index falls outside the current range.
- value Number
- Step index; omit to sync the thumb with the layer's current style.
Ext.getCmp('years_tl').getTimeline().updateMainThumbValue(2); // third stepvalue
String# Value stored in inputs.id[ID] (and inputs[i]): the key of the current step — the first element of the selected steps entry (e.g. "1990" or "January"), as a string.
valueValue stored in inputs.id[ID] (and inputs[i]): the key of the current step — the first element of the selected steps entry (e.g. "1990" or "January"), as a string. It changes whenever the main thumb moves (drag, click or animation) and the layer recalculates on the widget change event, after the layer style of the step was applied. The same change event is fired on the button (Ext.getCmp(id).on('change', function(button, value) {...})).
{{timeline|id=years_tl|nextStepInterval=1500|steps=[['1990', 'style_1990'], ['2000', 'style_2000'], ['2010', 'style_2010']]}}beforeCalc: function(inputs) {
var year = parseInt(inputs.id['years_tl'], 10);
}Published maps: styles from QGIS
QGIS1 entrystyles
String# Where a map's styles come from: they are not written in the query.
stylesWhere a map's styles come from: they are not written in the query. A map is published with one or more styles, and when it is published from QGIS the layer's QGIS style is converted at publication time, so the classes, colours and legend labels the map shows online are the ones set in QGIS. Each converted style becomes a Mappia style identifier - the map name without its namespace, plus _ and an index - and those identifiers are what a query selects with the styles property, what the layer's style chooser lists, and what the legend renders.
So changing how a map looks is a publication step, not a query change: restyle it in QGIS, publish again, and reference the style from the query.
{
       ...,
         name: 'CSR:estados',
         styles: 'estados_0',
       ...
  }
slider · number or range (input)
Slider17 entriesWritten in a layer's descriptionHtml as {{slider|parameter=value|...}}
backgroundColors
Array.<String># Array of colors of background slider values, to define background slider color based in slider value.
backgroundColorsArray of colors of background slider values, to define background slider color based in slider value. The values are defined from most to minimum with two properties each:
- color: {String} CSS color definition for the current interval. i.e. 'red','black','#FF0000', '#000000'.
- startValue: {Numeric} If defined define the initial value which above will apply this color, otherwise use theminimum slider value as default.
Ex.:
backgroundColors: [
{
// Define background color to red when slider has value above 75.
color: "red",
startValue: 75
},
{
// Define background color starting from value 0.
// That results two intervals, from 0 to 75 as blue, and from 76 to 100 as red.
color: "blue",
startValue: 0
}
]
cls
String# Extra CSS class(es) added to the slider element (appended to the default clickable).
clsExtra CSS class(es) added to the slider element (appended to the default clickable).
|cls=my_slider|disabled
Boolean= false# Set true to render the slider disabled (Ext disabled); enable it later with Ext.getCmp(id).enable().
disabledSet true to render the slider disabled (Ext disabled); enable it later with Ext.getCmp(id).enable().
|disabled=true|fieldLabel
String# Defines the label shown at the left of the slider (Ext fieldLabel).
fieldLabelDefines the label shown at the left of the slider (Ext fieldLabel).
|fieldLabel=Deforestation (%)|getValue
function() : Number# Returns the current value of a single-thumb slider.
getValueReturns the current value of a single-thumb slider. Call it on the component (Ext.getCmp(id) or a getid= reference), not on inputs.id[ID], which already holds the plain value.
Returns The current slider value.
var v = Ext.getCmp('deforestation_slider').getValue();getValues
function() : Array.<Number># Returns the value of every thumb; use it for range sliders created with values=[lo, hi].
getValuesReturns the value of every thumb; use it for range sliders created with values=[lo, hi].
Returns One value per thumb, in thumb order.
var range = Ext.getCmp('interval_slider').getValues(); // [lo, hi]gradient
Boolean= false# Set true to blend the backgroundColors into a continuous gradient along the filled part of the slider (each colour fading into the next from its startValue).
gradientSet true to blend the backgroundColors into a continuous gradient along the filled part of the slider (each colour fading into the next from its startValue). With the default false each interval is a solid colour, with a short blend only around the thumb. Has no effect without backgroundColors.
|backgroundColors=[{color: "green", startValue: 0}, {color: "red", startValue: 50}]|gradient=true|hideLabel
Boolean= false# Set true to hide the label and the space reserved for it (Ext hideLabel).
hideLabelSet true to hide the label and the space reserved for it (Ext hideLabel).
|hideLabel=true|id
String# Defines the id to identify the object.
idDefines the id to identify the object.
|id=example_slider|increment
Number# Defines the step of each increment or decrement in the actual value of the slider when being dragged.
incrementDefines the step of each increment or decrement in the actual value of the slider when being dragged.
|increment = 10|maxValue
Number# Defines the maximum value of the slider.
maxValueDefines the maximum value of the slider.
|maxValue = 100|minValue
Number# Defines the minimum value of the slider.
minValueDefines the minimum value of the slider.
|minValue = 0|setValue
function(value, animate)# Sets the slider value from code.
setValueSets the slider value from code. Firing the change event (the default) also updates inputs.id[ID] and recalculates the layer. For a range slider pass the thumb index first: setValue(index, value).
- value Number
- New value (clamped to
minValue/maxValue). - animate Boolean
- Set false to move the thumb without animation.
Ext.getCmp('deforestation_slider').setValue(20);thumbStyle
String= null# Defines extra CSS class(es) added to the slider thumb (the draggable handle), to restyle it.
thumbStyleDefines extra CSS class(es) added to the slider thumb (the draggable handle), to restyle it.
|thumbStyle=x-slider-thumb-cut|value
Number# Defines the initial value of the slider (default 100).
valueDefines the initial value of the slider (default 100).
At runtime the same value is what inputs.id[ID] (and inputs[i]) holds in beforeCalc/expression: a number, or an array [lower, upper] when the values range form is used. The layer recalculates on the slider change event (thumb released or value set from code).
|value = 100|beforeCalc: function(inputs) {
var threshold = inputs.id['deforestation_slider']; // number
}values
Array.<Number># Defines the slider interval limits.
valuesDefines the slider interval limits. If defined, the slider will be displayed as a range slider. It's return at the 'inputs' parameter will be a array of two values.
|values = [0, 250]||beforeCalc: function(inputs) {
let lowerValue = inputs[0][0]; // The value of the left drag
let upperValue = inputs[0][1]; // The value of the right drag
}|width
Number# Defines the slider width in pixels.
widthDefines the slider width in pixels. Any other Ext.slider.SingleSlider config (cls, fieldLabel, hideLabel, disabled, style, keyIncrement...) is also passed through unchanged.
|width=200|More layer properties
ConfigLayer1 entryuseLayerTooltip
Boolean|Numberproperty# If false, the layer tooltip is not shown.
useLayerTooltipIf false, the layer tooltip is not shown. If a number, the layer tooltip is shown for the specified layer. (Only supported for layers with source: "calculate") Otherwise follow tooltip default behavior that varies from map source
loadcsv · load a CSV table (input)
LoadCsv14 entriesWritten in a layer's descriptionHtml as {{loadcsv|parameter=value|...}}
columnNameToInd
function(columnName) : Number# Get the index of a column with the 'columnName' name.
columnNameToIndGet the index of a column with the 'columnName' name.
- columnName String
- Column name to search for.
Returns When it exists returns the column index, otherwise -1.
columnNamesToIndexes
function(columnNames) : Array.<Number># Resolves column names to column indexes: every string entry is looked up in the header (-1 when absent) and every numeric entry is kept as it is.
columnNamesToIndexesResolves column names to column indexes: every string entry is looked up in the header (-1 when absent) and every numeric entry is kept as it is. A single value is accepted in place of the array. This is what getLines/createIndexes do with their columns argument.
- columnNames Array.<(String|Number)>|String|Number
- Column names and/or indexes.
Returns The column indexes, in the same order.
inputs.id["fire_csv"].columnNamesToIndexes(["Year", 2]); // e.g. [1, 2]cors
Boolean= false# Downloads the CSV through the Mappia CORS proxy; use it for servers that do not send CORS headers.
corsDownloads the CSV through the Mappia CORS proxy; use it for servers that do not send CORS headers.
|cors=true|createIndexes
function(columns)# Create indexes for faster search.
createIndexesCreate indexes for faster search.
PS: Indexes are used to faster results on "getLines" calls, apply only when all [columns] are indexes.
- columns Array
- (Optional) Array of indexes/names of the filtered columns.
{...
    beforeCalc: function(inputs) {
        inputs.id['CSV_WIDGET_EXAMPLE_ID'].createIndexes(['Key', 'Year']);
        alert(inputs.id['CSV_WIDGET_EXAMPLE_ID'].getLines(['Key','Year'], [100, 2020]).length);
    }
}
getColunsInd
function() : Array.<String># Returns a copy of the header row — the column names, in order — so query code can discover columns instead of hard-coding indexes.
getColunsIndReturns a copy of the header row — the column names, in order — so query code can discover columns instead of hard-coding indexes. The name is a historical typo of getColumnsInd, kept for compatibility (the platform and many queries call it by this spelling; there is no correctly spelled alias).
Returns Copy of the header row.
var headers = inputs.id["fire_csv"].getColunsInd(); // ["Municipality", "Year", "Fires"]
var iFires = headers.indexOf("Fires");
getLineCount
function() : Number# Number of data lines in the table (the header line is not counted).
getLineCountNumber of data lines in the table (the header line is not counted).
Returns How many data lines the CSV has.
var csv = inputs.id["fire_csv"];
for (var i = 0; i < csv.getLineCount(); i++) total += parseFloat(csv.getValue(2, i));
getLines
function(columns, values, includeHeader) : Array.<Array.<String>># Returns the lines (arrays of cell strings) whose cells in columns equal the corresponding entries of values.
getLinesReturns the lines (arrays of cell strings) whose cells in columns equal the corresponding entries of values. Columns may be given by index or by header name; to filter on several columns give one value per column, e.g. getLines([1, "Year"], ["Park A", 2024]). Values are compared as strings (the CSV is always text). Called with no arguments it returns every data line (header skipped) — a common idiom. When all filtered columns were indexed with createIndexes the lookup uses the index instead of scanning every line.
- columns Array.<(String|Number)>
- Indexes and/or names of the columns to filter on.
- values Array
- One value per entry of
columns. - includeHeader Boolean
- True to also return the header line when it matches (only in the scanning path, i.e. without indexes).
Returns The matching lines; all data lines when no filter is given.
var csv = inputs.id["fire_csv"];
var rows2024 = csv.getLines(["Year"], [2024]);      // by header name
var rowsParkA = csv.getLines([0, "Year"], ["Park A", 2024]); // two columns
var allRows = csv.getLines();                         // every data line
getValue
function(column, line, includeHeader) : String# Get a value by the matrix index and column.
getValueGet a value by the matrix index and column.
- column Number
- Column index (First index is 0).
- line Number
- Line index (First index is 0).
- includeHeader boolean
- True to include the header line in the matrix index, False to ignore.
Returns Get the cell value.
id
String# Defines the id of the input; it is the key used to read the table in inputs.id[ID] (required, the tool renders nothing visible).
idDefines the id of the input; it is the key used to read the table in inputs.id[ID] (required, the tool renders nothing visible).
|id=emissions_csv|removeEmptyLines
boolean= false# Ignore the empty lines, removing them from the parsed CSV.
removeEmptyLinesIgnore the empty lines, removing them from the parsed CSV. True to remove the empty lines from the CSV.
setValue
function(column, line, value)# Change a cell value by its cell index.
setValueChange a cell value by its cell index.
- column Numeric
- Column index.
- line Numeric
- Line index to change (ignore the header information when it exists).
- value *
- New value to replace the older value.
trim
Boolean= false# Requests that cell values be trimmed of surrounding whitespace.
trimRequests that cell values be trimmed of surrounding whitespace. The flag is accepted and forwarded to the CSV parser, but the current parser ignores it (cells are stored as written, quotes removed), so trim values yourself when needed. Kept for compatibility with existing queries.
|trim=true|url
String# Defines the URL of the CSV file to download (required).
urlDefines the URL of the CSV file to download (required). Relative URLs are resolved against the Mappia host, so backend endpoints such as /wmtp/calc/... work; escape = inside query strings as \=. The layer waits for the download before calculating.
|url=/theme/app/data/emissoesco2.csv||url=/wmtp/calc/areacategorical/?layers\=CSR:estados&styles\=1|value
ExtjsUtils.CSV.CsvTable# Value stored in inputs.id[ID]: an ExtjsUtils.CSV.CsvTable wrapping the parsed file (first row = header).
valueValue stored in inputs.id[ID]: an ExtjsUtils.CSV.CsvTable wrapping the parsed file (first row = header). Read it with the CsvTable methods listed in this group (getLines, getValue, columnNameToInd, createIndexes, getLineCount...). It is undefined until the download finishes: the layer waits for the resource and recalculates on its waitend event, so beforeCalc/expression can rely on it being loaded.
{{loadcsv|id=emissions_csv|url=/theme/app/data/emissoesco2.csv|removeEmptyLines=true}}beforeCalc: function(inputs) {
var csv = inputs.id['emissions_csv']; // columns: percentage, carbon_loss
var rows = csv.getLines(0, '25'); // rows whose first column equals 25
}Highcharts · charts
Highcharts1 entryUsage: (Highcharts.chart(DOM_ID, {});)
chart
function(renderTo, options) : Object# Highcharts is loaded by the calculator and editor pages, so a query can call Highcharts.chart(...) without loading anything: put a container in the layer's descriptionHtml and create the chart …
chartWritten as Highcharts.chart
Highcharts is loaded by the calculator and editor pages, so a query can call Highcharts.chart(...) without loading anything: put a container in the layer's descriptionHtml and create the chart once the panel exists - in onInputsReady, in beforeCalc or in a widget handler - then update it as results arrive instead of recreating it. ExtjsUtils.HIGHCHART.getById(id) gives the chart back from the container's id, which is what makes the update possible from another callback.
The bundled build covers the standard chart types plus highcharts-more. Extra modules are loaded on demand with AsyncLoader.loadScriptOnce (see the Sankey entry).
- renderTo String
- Id of the container element declared in
descriptionHtml. - options Object
- The Highcharts configuration object.
Returns The chart instance.
descriptionHtml: '<div id="emissions_chart" style="height:220px"></div>',
functions: {
    drawChart: function (values) {
        var chart = ExtjsUtils.HIGHCHART.getById('emissions_chart');
        if (chart) { chart.series[0].setData(values); return; }
        Highcharts.chart('emissions_chart', {
            chart: { type: 'column' },
            title: { text: 'Emissions by year' },
            xAxis: { categories: ['2020', '2021', '2022'] },
            series: [{ name: 'Mt', data: values }]
        });
    }
}
legendhtml · legend of the calculated map
LegendHtml7 entriesWritten in a layer's descriptionHtml as {{legendhtml|parameter=value|...}}
Usage: '{{legendhtml}}'
autoWidth
Boolean= true# Set true (default) to let the legend panel take the width of its container; set false to give it a fixed width.
autoWidthSet true (default) to let the legend panel take the width of its container; set false to give it a fixed width.
|autoWidth=false|width=250|filterLayers
Array.<Number>= null# Defines an array of indexes of layers to be included in map legend (from 0 to quantity of layers).
filterLayersDefines an array of indexes of layers to be included in map legend (from 0 to quantity of layers). If not defined, all layer legends are shown by default. Otherwise, only the listed indexes are included.
Ex: A composed layer with three maps: name: "CSR:estados,CSR:roads,CSR:municipalities", If 'filterLayers=[0,1]' is defined in the layer object only the legends of 'CSR:estatdos' and 'CSR:roads' are shown.
|filterLayers = [1,2]|id
String# Defines the id of the legend panel component (Ext.getCmp(id)), e.g. to show()/hide() it or to find the legend entries inside it.
idDefines the id of the legend panel component (Ext.getCmp(id)), e.g. to show()/hide() it or to find the legend entries inside it. Generated when omitted. Other GeoExt.WMSLegend/Ext.Panel configs (cls, style, hidden, useScaleParameter, autoWidth...) are passed through.
|id=main_legend|legendId
String= null# Defines the legend container id.
legendIdDefines the legend container id. You can use this id to toggle each legend filter individually.
|legendId=WIDGET_OBJECT_ID|preventClick
Boolean= false# Defines if the user can filter the maps categories by clicking on the legend.
preventClickDefines if the user can filter the maps categories by clicking on the legend. Set it true to ignore the legend click, false otherwise.
|preventClick = true|reverseLegend
Boolean= false# Defines if it should sort the legend on the decreasing order.
reverseLegendDefines if it should sort the legend on the decreasing order. Set it true to use the decreasing order, false otherwise.
|reverseLegend = true|useScaleParameter
Boolean= false# Set true to request a new legend image from the server whenever the map scale changes (GeoServer SCALE parameter), for styles that depend on the scale.
useScaleParameterSet true to request a new legend image from the server whenever the map scale changes (GeoServer SCALE parameter), for styles that depend on the scale. Off by default: the legend is generated once and reused, which is faster and keeps the click-to-filter behaviour stable.
|useScaleParameter=true|Layer properties
LayersProperties2 entrieshideLegendButton
Boolean= falseproperty# Hides the legend of the layer in its Legend Window.
hideLegendButtonHides the legend of the layer in its Legend Window. Set it to 'true' to hide it, 'false' to display it. It applies to every layer source: on a local layer it hides the "show legend" toggle button of the row; on a calculate, file or xyz layer it hides the generated legend container (with the legend title and the opacity slider) and the "show legend" button at the bottom of the query section, so only the descriptionHtml remains.
[
  {
     title: 'Hiding the Legend Button',
     color: '#FFA500',
     elements: [
        {
           title: 'The Layer Legend Button will be hidden',
           name: 'CSR:geologia',
           source: 'calculate',
           visibility: true,
           hideLegendButton: true,
           descriptionHtml:
              '{{label|text=The legend button is hidden, only the descriptionHtml is visible}}',
        },
     ],
  },
]
visibility
Boolean= falseproperty# Define if the Layer should start visible or not.
visibilityDefine if the Layer should start visible or not. Set it to 'true' for the Layer start visible. Otherwise, set it to 'false' and the Layer will start hidden.
[
 {
   title: 'Example of visibility in a Layer',
   color: '#666699',
   elements: [
     {
       title: 'This layer will start visible',
       name: 'CSR:geologia',
       source: 'local',
       visibility: true,
     },
   ],
 },
]